Weather Plumes before Maastricht / Beek
Groningen | Leeuwarden | Den Helder | Schiphol | De Bilt | Twente | Vlissingen | Maastricht
(Zo lees je de pluim)
How do you read the weather plume?
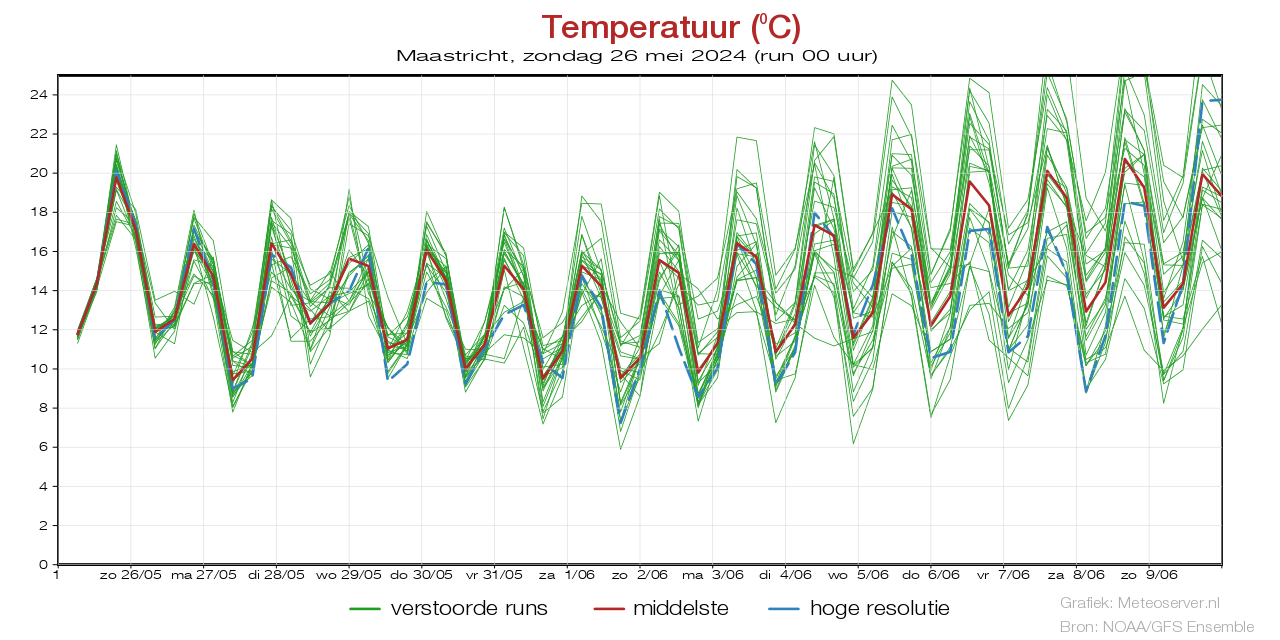
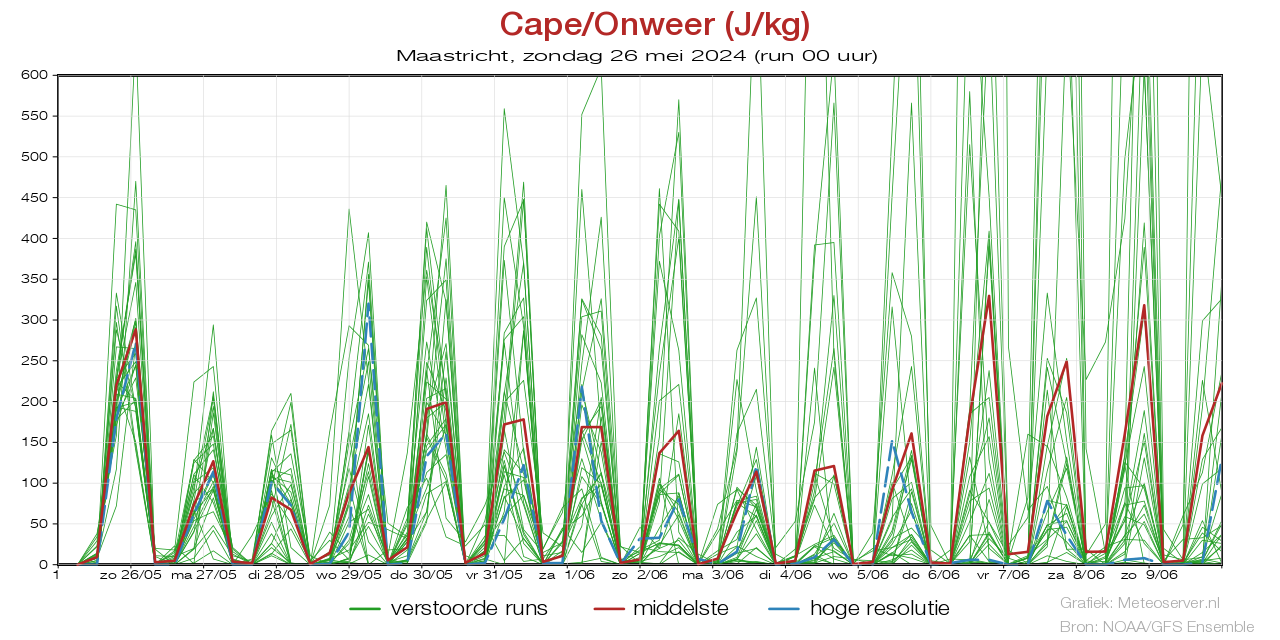
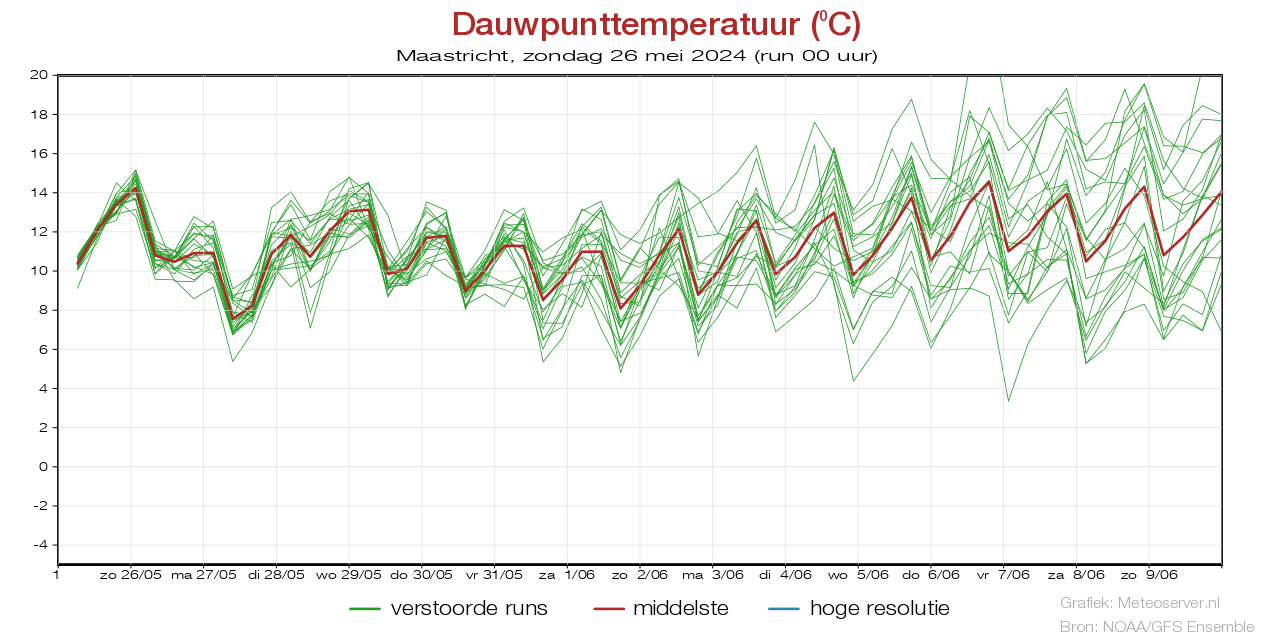
These plumes, just like the weather maps, are also generated by weather models: the supercomputer of the weather service - in this case the KNMI - uses smart algorithms to estimate the future weather condition.
The model always starts with measurements of the weather condition when the computer starts calculating. These are measurements of, for example, wind direction and speed, air pressure, relative humidity and temperature. The algorithm then extrapolates that knowledge - and the way in which these values interact - to the future, the results of which you see in the form of the green lines. This happens 52 times in a row, these are the 'members' of the plume. Each time the model changes an initial value. For example, if it is now 7.5 °C, the next 'run' can start at 7.6 °C. This automatically makes the outcome of each run slightly different.
Uncertainty in the model
That uncertainty is necessary, because the weather is uncertain. You never know exactly what it will be, so setting expectations is often better if you also build that uncertainty into the calculation. Once the model has rotated 52 times, the ideal center is calculated (the thick red dotted line). There is a good chance that the future weather pattern will resemble this. The calculations are carried out 4 times a day to always take the new current values as a starting point. You also see that as the days progress, the uncertainty increases. The further apart the green lines are, the higher the uncertainty.
Fact
Fun fact: the graph is called a plume because it looks a bit like smoke blowing out of a chimney with the wind.
Wind forecast
Netherlands
Wind forecast nodes
Beaufort wind forecast
Wind forecast + air pressure
Wadden Sea
Wind forecast nodes
Beaufort wind forecast
Wind forecast + air pressure
IJsselmeer and Frisian Lakes
Wind forecast nodes
Beaufort wind forecast
Wind forecast + air pressure
Zeeland
Wind forecast nodes
Beaufort wind forecast
Wind forecast + air pressure
Weather maps
HiRLAM analysis
DWD ICON expectation
ECMWF 850 hPa
Current satellite image
Synoptic analysis KNMI
Plumes the Netherlands