Current water level
Water level compared to LAT: 463 cm
Measurement time: 06:30 uur
On the water map
Choose your tide station
Download the app
With the The Tides app you have the current tide data at hand anytime, anywhere.
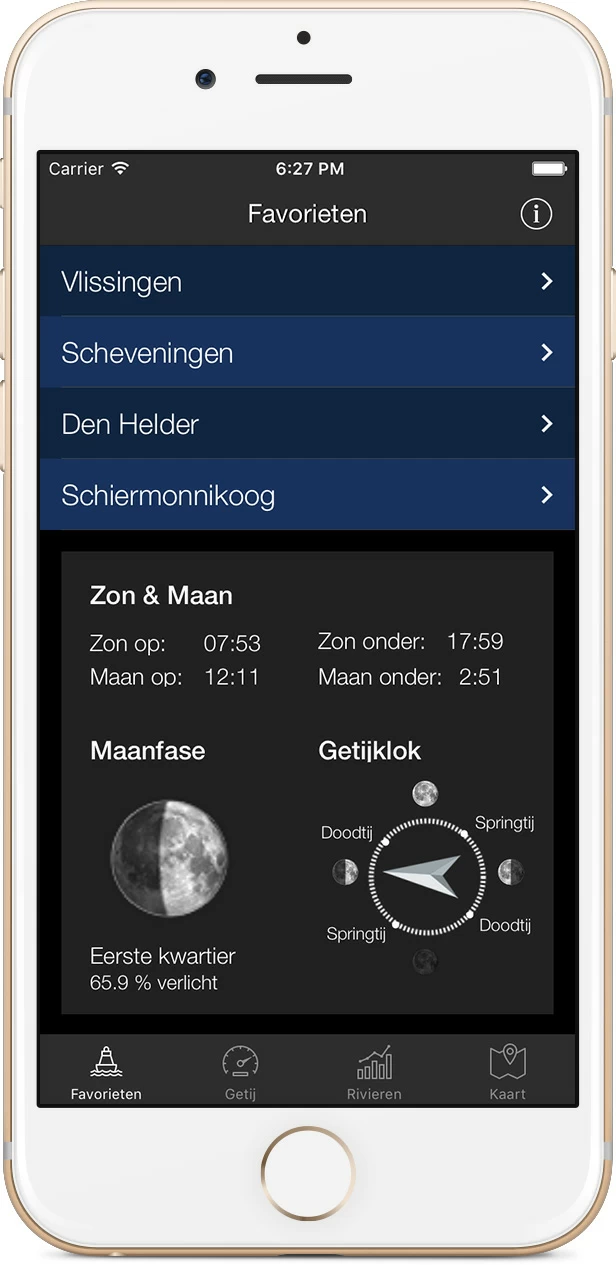
Download the app for iOS or Android.
The tide ahead Vlissingen
| 3 August Low water at 00:01 Water level compared to NAP: -211 cm | LAT: 45 cm |
| 3 August High water at 05:46 Water level compared to NAP: 230 cm | LAT: 486 cm |
| 3 August Low water at 12:02 Water level compared to NAP: -166 cm | LAT: 90 cm |
| 3 August High water at 18:02 Water level compared to NAP: 223 cm | LAT: 479 cm |
| 4 August Low water at 00:37 Water level compared to NAP: -209 cm | LAT: 47 cm |
| 4 August High water at 06:24 Water level compared to NAP: 226 cm | LAT: 482 cm |
| 4 August Low water at 12:38 Water level compared to NAP: -166 cm | LAT: 90 cm |
| 4 August High water at 18:40 Water level compared to NAP: 221 cm | LAT: 477 cm |
| 5 August Low water at 01:14 Water level compared to NAP: -205 cm | LAT: 51 cm |
| 5 August High water at 07:06 Water level compared to NAP: 218 cm | LAT: 474 cm |
| 5 August Low water at 13:19 Water level compared to NAP: -165 cm | LAT: 91 cm |
| 5 August High water at 19:25 Water level compared to NAP: 213 cm | LAT: 469 cm |
| 6 August Low water at 01:57 Water level compared to NAP: -197 cm | LAT: 59 cm |
| 6 August High water at 07:58 Water level compared to NAP: 203 cm | LAT: 459 cm |
| 6 August Low water at 14:08 Water level compared to NAP: -160 cm | LAT: 96 cm |
| 6 August High water at 20:21 Water level compared to NAP: 198 cm | LAT: 454 cm |
| 7 August Low water at 02:50 Water level compared to NAP: -183 cm | LAT: 73 cm |
| 7 August High water at 09:04 Water level compared to NAP: 184 cm | LAT: 440 cm |
| 7 August Low water at 15:12 Water level compared to NAP: -149 cm | LAT: 107 cm |
| 7 August High water at 21:34 Water level compared to NAP: 180 cm | LAT: 436 cm |
| 8 August Low water at 03:58 Water level compared to NAP: -165 cm | LAT: 91 cm |
| 8 August High water at 10:18 Water level compared to NAP: 169 cm | LAT: 425 cm |
| 8 August Low water at 16:34 Water level compared to NAP: -142 cm | LAT: 114 cm |
| 8 August High water at 22:54 Water level compared to NAP: 172 cm | LAT: 428 cm |
| 9 August Low water at 05:21 Water level compared to NAP: -154 cm | LAT: 102 cm |
| 9 August High water at 11:38 Water level compared to NAP: 166 cm | LAT: 422 cm |
| 9 August Low water at 18:02 Water level compared to NAP: -150 cm | LAT: 106 cm |
| 10 August High water at 00:12 Water level compared to NAP: 182 cm | LAT: 438 cm |
| 10 August Low water at 06:42 Water level compared to NAP: -158 cm | LAT: 98 cm |
| 10 August High water at 12:51 Water level compared to NAP: 181 cm | LAT: 437 cm |
| 10 August Low water at 19:18 Water level compared to NAP: -172 cm | LAT: 84 cm |
| 11 August High water at 01:20 Water level compared to NAP: 207 cm | LAT: 463 cm |
| 11 August Low water at 07:46 Water level compared to NAP: -169 cm | LAT: 87 cm |
| 11 August High water at 13:50 Water level compared to NAP: 203 cm | LAT: 459 cm |
| 11 August Low water at 20:18 Water level compared to NAP: -197 cm | LAT: 59 cm |
| 12 August High water at 02:15 Water level compared to NAP: 232 cm | LAT: 488 cm |
| 12 August Low water at 08:37 Water level compared to NAP: -178 cm | LAT: 78 cm |
| 12 August High water at 14:39 Water level compared to NAP: 223 cm | LAT: 479 cm |
| 12 August Low water at 21:09 Water level compared to NAP: -217 cm | LAT: 39 cm |
| 13 August High water at 03:02 Water level compared to NAP: 250 cm | LAT: 506 cm |
| 13 August Low water at 09:23 Water level compared to NAP: -181 cm | LAT: 75 cm |
| 13 August High water at 15:22 Water level compared to NAP: 237 cm | LAT: 493 cm |
| 3 Aug, 05:40 Water level compared to NAP: 230 cm | LAT: 482 cm |
| 3 Aug, 05:50 Water level compared to NAP: 230 cm | LAT: 481 cm |
| 3 Aug, 06:00 Water level compared to NAP: 228 cm | LAT: 478 cm |
| 3 Aug, 06:10 Water level compared to NAP: 224 cm | LAT: 475 cm |
| 3 Aug, 06:20 Water level compared to NAP: 218 cm | LAT: 470 cm |
| 3 Aug, 06:30 Water level compared to NAP: 211 cm | LAT: 463 cm |
| 3 Aug, 06:40 Water level compared to NAP: 204 cm | LAT: 457 cm |
| 3 Aug, 06:50 Water level compared to NAP: 197 cm | LAT: 449 cm |
| 3 Aug, 07:00 Water level compared to NAP: 190 cm | LAT: 440 cm |
| 3 Aug, 07:10 Water level compared to NAP: 183 cm | LAT: 431 cm |
| 3 Aug, 07:20 Water level compared to NAP: 175 cm | LAT: 423 cm |
| 3 Aug, 07:30 Water level compared to NAP: 166 cm | LAT: 413 cm |
| 3 Aug, 07:40 Water level compared to NAP: 156 cm | LAT: 403 cm |
| 3 Aug, 07:50 Water level compared to NAP: 145 cm | LAT: 392 cm |
| 3 Aug, 08:00 Water level compared to NAP: 134 cm | LAT: 380 cm |
| 3 Aug, 08:10 Water level compared to NAP: 121 cm | LAT: 367 cm |
| 3 Aug, 08:20 Water level compared to NAP: 106 cm | LAT: 353 cm |
| 3 Aug, 08:30 Water level compared to NAP: 91 cm | LAT: 338 cm |
| 3 Aug, 08:40 Water level compared to NAP: 75 cm | LAT: 323 cm |
| 3 Aug, 08:50 Water level compared to NAP: 58 cm | LAT: 307 cm |
| 3 Aug, 09:00 Water level compared to NAP: 40 cm | LAT: 289 cm |
| 3 Aug, 09:10 Water level compared to NAP: 22 cm | LAT: 273 cm |
| 3 Aug, 09:20 Water level compared to NAP: 4 cm | LAT: 256 cm |
| 3 Aug, 09:30 Water level compared to NAP: -14 cm | LAT: 240 cm |
| 3 Aug, 09:40 Water level compared to NAP: -31 cm | LAT: 223 cm |
| 3 Aug, 09:50 Water level compared to NAP: -48 cm | LAT: 207 cm |
| 3 Aug, 10:00 Water level compared to NAP: -64 cm | LAT: 192 cm |
| 3 Aug, 10:10 Water level compared to NAP: -79 cm | LAT: 177 cm |
| 3 Aug, 10:20 Water level compared to NAP: -92 cm | LAT: 163 cm |
| 3 Aug, 10:30 Water level compared to NAP: -105 cm | LAT: 150 cm |
| 3 Aug, 10:40 Water level compared to NAP: -116 cm | LAT: 137 cm |
| 3 Aug, 10:50 Water level compared to NAP: -126 cm | LAT: 126 cm |
| 3 Aug, 11:00 Water level compared to NAP: -136 cm | LAT: 115 cm |
| 3 Aug, 11:10 Water level compared to NAP: -144 cm | LAT: 107 cm |
| 3 Aug, 11:20 Water level compared to NAP: -151 cm | LAT: 99 cm |
| 3 Aug, 11:30 Water level compared to NAP: -157 cm | LAT: 94 cm |
| 3 Aug, 11:40 Water level compared to NAP: -161 cm | LAT: 90 cm |
| 3 Aug, 11:50 Water level compared to NAP: -164 cm | LAT: 90 cm |
| 3 Aug, 12:00 Water level compared to NAP: -166 cm | LAT: 90 cm |
| 3 Aug, 12:10 Water level compared to NAP: -165 cm | LAT: 94 cm |
| 3 Aug, 12:20 Water level compared to NAP: -163 cm | LAT: 99 cm |
| 3 Aug, 12:30 Water level compared to NAP: -159 cm | LAT: 106 cm |
| 3 Aug, 12:40 Water level compared to NAP: -153 cm | LAT: 112 cm |
| 3 Aug, 12:50 Water level compared to NAP: -147 cm | LAT: 119 cm |
| 3 Aug, 13:00 Water level compared to NAP: -140 cm | LAT: 127 cm |
| 3 Aug, 13:10 Water level compared to NAP: -133 cm | LAT: 134 cm |
| 3 Aug, 13:20 Water level compared to NAP: -125 cm | LAT: 140 cm |
| 3 Aug, 13:30 Water level compared to NAP: -117 cm | LAT: 146 cm |
| 3 Aug, 13:40 Water level compared to NAP: -109 cm | LAT: 152 cm |
| 3 Aug, 13:50 Water level compared to NAP: -101 cm | LAT: 159 cm |
| 3 Aug, 14:00 Water level compared to NAP: -93 cm | LAT: 166 cm |
| 3 Aug, 14:10 Water level compared to NAP: -85 cm | LAT: 173 cm |
| 3 Aug, 14:20 Water level compared to NAP: -77 cm | LAT: 181 cm |
| 3 Aug, 14:30 Water level compared to NAP: -68 cm | LAT: 190 cm |
| 3 Aug, 14:40 Water level compared to NAP: -59 cm | LAT: 198 cm |
| 3 Aug, 14:50 Water level compared to NAP: -51 cm | LAT: 208 cm |
| 3 Aug, 15:00 Water level compared to NAP: -42 cm | LAT: 216 cm |
| 3 Aug, 15:10 Water level compared to NAP: -33 cm | LAT: 226 cm |
| 3 Aug, 15:20 Water level compared to NAP: -24 cm | LAT: 236 cm |
| 3 Aug, 15:30 Water level compared to NAP: -13 cm | LAT: 247 cm |
| 3 Aug, 15:40 Water level compared to NAP: -2 cm | LAT: 258 cm |
| 3 Aug, 15:50 Water level compared to NAP: 11 cm | LAT: 271 cm |
| 3 Aug, 16:00 Water level compared to NAP: 25 cm | LAT: 285 cm |
| 3 Aug, 16:10 Water level compared to NAP: 42 cm | LAT: 302 cm |
| 3 Aug, 16:20 Water level compared to NAP: 62 cm | LAT: 321 cm |
| 3 Aug, 16:30 Water level compared to NAP: 83 cm | LAT: 344 cm |
| 3 Aug, 16:40 Water level compared to NAP: 105 cm | LAT: 369 cm |
| 3 Aug, 16:50 Water level compared to NAP: 128 cm | LAT: 396 cm |
| 3 Aug, 17:00 Water level compared to NAP: 150 cm | LAT: 421 cm |
| 3 Aug, 17:10 Water level compared to NAP: 171 cm | LAT: 442 cm |
| 3 Aug, 17:20 Water level compared to NAP: 189 cm | LAT: 459 cm |
| 3 Aug, 17:30 Water level compared to NAP: 203 cm | LAT: 471 cm |
| 3 Aug, 17:40 Water level compared to NAP: 214 cm | LAT: 478 cm |
| 3 Aug, 17:50 Water level compared to NAP: 220 cm | LAT: 482 cm |
| 3 Aug, 18:00 Water level compared to NAP: 223 cm | LAT: 482 cm |
| 3 Aug, 18:10 Water level compared to NAP: 222 cm | LAT: 479 cm |
| 3 Aug, 18:20 Water level compared to NAP: 218 cm | LAT: 474 cm |
| 3 Aug, 18:30 Water level compared to NAP: 212 cm | LAT: 468 cm |
| 3 Aug, 18:40 Water level compared to NAP: 205 cm | LAT: 461 cm |
| 3 Aug, 18:50 Water level compared to NAP: 197 cm | LAT: 453 cm |
| 3 Aug, 19:00 Water level compared to NAP: 188 cm | LAT: 446 cm |
| 3 Aug, 19:10 Water level compared to NAP: 180 cm | LAT: 437 cm |
| 3 Aug, 19:20 Water level compared to NAP: 171 cm | LAT: 428 cm |
| 3 Aug, 19:30 Water level compared to NAP: 162 cm | LAT: 419 cm |
| 3 Aug, 19:40 Water level compared to NAP: 153 cm | LAT: 408 cm |
| 3 Aug, 19:50 Water level compared to NAP: 144 cm | LAT: 398 cm |
| 3 Aug, 20:00 Water level compared to NAP: 133 cm | LAT: 388 cm |
| 3 Aug, 20:10 Water level compared to NAP: 122 cm | LAT: 376 cm |
| 3 Aug, 20:20 Water level compared to NAP: 110 cm | LAT: 363 cm |
| 3 Aug, 20:30 Water level compared to NAP: 96 cm | LAT: 349 cm |
| 3 Aug, 20:40 Water level compared to NAP: 82 cm | LAT: 335 cm |
| 3 Aug, 20:50 Water level compared to NAP: 66 cm | LAT: 319 cm |
| 3 Aug, 21:00 Water level compared to NAP: 50 cm | LAT: 303 cm |
| 3 Aug, 21:10 Water level compared to NAP: 32 cm | LAT: 287 cm |
| 3 Aug, 21:20 Water level compared to NAP: 14 cm | LAT: 270 cm |
| 3 Aug, 21:30 Water level compared to NAP: -5 cm | LAT: 253 cm |
| 3 Aug, 21:40 Water level compared to NAP: -23 cm | LAT: 236 cm |
| 3 Aug, 21:50 Water level compared to NAP: -42 cm | LAT: 218 cm |
| 3 Aug, 22:00 Water level compared to NAP: -59 cm | LAT: 202 cm |
| 3 Aug, 22:10 Water level compared to NAP: -76 cm | LAT: 186 cm |
| 3 Aug, 22:20 Water level compared to NAP: -92 cm | LAT: 171 cm |
| 3 Aug, 22:30 Water level compared to NAP: -107 cm | LAT: 155 cm |
| 3 Aug, 22:40 Water level compared to NAP: -121 cm | LAT: 142 cm |
| 3 Aug, 22:50 Water level compared to NAP: -133 cm | LAT: 129 cm |
| 3 Aug, 23:00 Water level compared to NAP: -144 cm | LAT: 116 cm |
| 3 Aug, 23:10 Water level compared to NAP: -155 cm | LAT: 105 cm |
| 3 Aug, 23:20 Water level compared to NAP: -165 cm | LAT: 94 cm |
| 3 Aug, 23:30 Water level compared to NAP: -174 cm | LAT: 84 cm |
| 3 Aug, 23:40 Water level compared to NAP: -183 cm | LAT: 75 cm |
| 3 Aug, 23:50 Water level compared to NAP: -190 cm | LAT: 67 cm |
| 4 Aug, 00:00 Water level compared to NAP: -197 cm | LAT: 61 cm |
| 4 Aug, 00:10 Water level compared to NAP: -202 cm | LAT: 56 cm |
| 4 Aug, 00:20 Water level compared to NAP: -206 cm | LAT: 52 cm |
| 4 Aug, 00:30 Water level compared to NAP: -208 cm | LAT: 52 cm |
| 4 Aug, 00:40 Water level compared to NAP: -208 cm | LAT: 53 cm |
| 4 Aug, 00:50 Water level compared to NAP: -207 cm | LAT: 57 cm |
| 4 Aug, 01:00 Water level compared to NAP: -204 cm | LAT: 61 cm |
| 4 Aug, 01:10 Water level compared to NAP: -199 cm | LAT: 68 cm |
| 4 Aug, 01:20 Water level compared to NAP: -193 cm | LAT: 76 cm |
| 4 Aug, 01:30 Water level compared to NAP: -187 cm | LAT: 83 cm |
| 4 Aug, 01:40 Water level compared to NAP: -179 cm | LAT: 90 cm |
| 4 Aug, 01:50 Water level compared to NAP: -171 cm | LAT: 98 cm |
| 4 Aug, 02:00 Water level compared to NAP: -163 cm | LAT: 105 cm |
| 4 Aug, 02:10 Water level compared to NAP: -154 cm | LAT: 112 cm |
| 4 Aug, 02:20 Water level compared to NAP: -145 cm | LAT: 119 cm |
| 4 Aug, 02:30 Water level compared to NAP: -135 cm | LAT: 127 cm |
| 4 Aug, 02:40 Water level compared to NAP: -126 cm | LAT: 135 cm |
| 4 Aug, 02:50 Water level compared to NAP: -116 cm | LAT: 144 cm |
| 4 Aug, 03:00 Water level compared to NAP: -105 cm | LAT: 154 cm |
| 4 Aug, 03:10 Water level compared to NAP: -95 cm | LAT: 165 cm |
| 4 Aug, 03:20 Water level compared to NAP: -84 cm | LAT: 176 cm |
| 4 Aug, 03:30 Water level compared to NAP: -72 cm | LAT: 189 cm |
| 4 Aug, 03:40 Water level compared to NAP: -60 cm | LAT: 203 cm |
| 4 Aug, 03:50 Water level compared to NAP: -46 cm | LAT: 217 cm |
| 4 Aug, 04:00 Water level compared to NAP: -31 cm | LAT: 234 cm |
| 4 Aug, 04:10 Water level compared to NAP: -14 cm | LAT: 252 cm |
| 4 Aug, 04:20 Water level compared to NAP: 5 cm | LAT: 271 cm |
| 4 Aug, 04:30 Water level compared to NAP: 26 cm | LAT: 295 cm |
| 4 Aug, 04:40 Water level compared to NAP: 49 cm | LAT: 321 cm |
| 4 Aug, 04:50 Water level compared to NAP: 74 cm | LAT: 350 cm |
| 4 Aug, 05:00 Water level compared to NAP: 100 cm | LAT: 380 cm |
| 4 Aug, 05:10 Water level compared to NAP: 125 cm | LAT: 408 cm |
| 4 Aug, 05:20 Water level compared to NAP: 149 cm | LAT: 431 cm |
| 4 Aug, 05:30 Water level compared to NAP: 171 cm | LAT: 449 cm |
| 4 Aug, 05:40 Water level compared to NAP: 190 cm | LAT: 462 cm |
| 4 Aug, 05:50 Water level compared to NAP: 205 cm | LAT: 472 cm |
| 4 Aug, 06:00 Water level compared to NAP: 216 cm | LAT: 478 cm |
| 4 Aug, 06:10 Water level compared to NAP: 223 cm | LAT: 481 cm |
| 4 Aug, 06:20 Water level compared to NAP: 226 cm | LAT: 481 cm |
| 4 Aug, 06:30 Water level compared to NAP: 225 cm | LAT: 480 cm |
| 4 Aug, 06:40 Water level compared to NAP: 222 cm | LAT: 478 cm |
| 4 Aug, 06:50 Water level compared to NAP: 217 cm | LAT: 474 cm |
| 4 Aug, 07:00 Water level compared to NAP: 210 cm | LAT: 469 cm |
| 4 Aug, 07:10 Water level compared to NAP: 203 cm | LAT: 462 cm |
| 4 Aug, 07:20 Water level compared to NAP: 195 cm | LAT: 455 cm |
| 4 Aug, 07:30 Water level compared to NAP: 187 cm | LAT: 447 cm |
| 4 Aug, 07:40 Water level compared to NAP: 179 cm | LAT: 438 cm |
| 4 Aug, 07:50 Water level compared to NAP: 171 cm | LAT: 429 cm |
| 4 Aug, 08:00 Water level compared to NAP: 163 cm | LAT: 420 cm |
| 4 Aug, 08:10 Water level compared to NAP: 154 cm | LAT: 410 cm |
| 4 Aug, 08:20 Water level compared to NAP: 144 cm | LAT: 401 cm |
| 4 Aug, 08:30 Water level compared to NAP: 133 cm | LAT: 389 cm |
| 4 Aug, 08:40 Water level compared to NAP: 122 cm | LAT: 377 cm |
| 4 Aug, 08:50 Water level compared to NAP: 109 cm | LAT: 363 cm |
| 4 Aug, 09:00 Water level compared to NAP: 96 cm | LAT: 350 cm |
| 4 Aug, 09:10 Water level compared to NAP: 81 cm | LAT: 334 cm |
| 4 Aug, 09:20 Water level compared to NAP: 65 cm | LAT: 319 cm |
| 4 Aug, 09:30 Water level compared to NAP: 49 cm | LAT: 303 cm |
| 4 Aug, 09:40 Water level compared to NAP: 31 cm | LAT: 286 cm |
| 4 Aug, 09:50 Water level compared to NAP: 13 cm | LAT: 271 cm |
| 4 Aug, 10:00 Water level compared to NAP: -5 cm | LAT: 254 cm |
| 4 Aug, 10:10 Water level compared to NAP: -23 cm | LAT: 238 cm |
| 4 Aug, 10:20 Water level compared to NAP: -40 cm | LAT: 223 cm |
| 4 Aug, 10:30 Water level compared to NAP: -57 cm | LAT: 208 cm |
| 4 Aug, 10:40 Water level compared to NAP: -73 cm | LAT: 193 cm |
| 4 Aug, 10:50 Water level compared to NAP: -87 cm | LAT: 179 cm |
| 4 Aug, 11:00 Water level compared to NAP: -100 cm | LAT: 166 cm |
| 4 Aug, 11:10 Water level compared to NAP: -112 cm | LAT: 153 cm |
| 4 Aug, 11:20 Water level compared to NAP: -123 cm | LAT: 141 cm |
| 4 Aug, 11:30 Water level compared to NAP: -132 cm | LAT: 130 cm |
| 4 Aug, 11:40 Water level compared to NAP: -141 cm | LAT: 121 cm |
| 4 Aug, 11:50 Water level compared to NAP: -148 cm | LAT: 111 cm |
| 4 Aug, 12:00 Water level compared to NAP: -154 cm | LAT: 105 cm |
| 4 Aug, 12:10 Water level compared to NAP: -159 cm | LAT: 100 cm |
| 4 Aug, 12:20 Water level compared to NAP: -163 cm | LAT: 97 cm |
| 4 Aug, 12:30 Water level compared to NAP: -165 cm | LAT: 96 cm |
| 4 Aug, 12:40 Water level compared to NAP: -166 cm | LAT: 96 cm |
| 4 Aug, 12:50 Water level compared to NAP: -165 cm | LAT: 100 cm |
| 4 Aug, 13:00 Water level compared to NAP: -162 cm | LAT: 104 cm |
| 4 Aug, 13:10 Water level compared to NAP: -157 cm | LAT: 110 cm |
| 4 Aug, 13:20 Water level compared to NAP: -152 cm | LAT: 117 cm |
| 4 Aug, 13:30 Water level compared to NAP: -145 cm | LAT: 123 cm |
| 4 Aug, 13:40 Water level compared to NAP: -137 cm | LAT: 130 cm |
| 4 Aug, 13:50 Water level compared to NAP: -129 cm | LAT: 137 cm |
| 4 Aug, 14:00 Water level compared to NAP: -121 cm | LAT: 143 cm |
| 4 Aug, 14:10 Water level compared to NAP: -113 cm | LAT: 148 cm |
| 4 Aug, 14:20 Water level compared to NAP: -105 cm | LAT: 154 cm |
| 4 Aug, 14:30 Water level compared to NAP: -96 cm | LAT: 161 cm |
| 4 Aug, 14:40 Water level compared to NAP: -88 cm | LAT: 168 cm |
| 4 Aug, 14:50 Water level compared to NAP: -80 cm | LAT: 175 cm |
| 4 Aug, 15:00 Water level compared to NAP: -71 cm | LAT: 183 cm |
| 4 Aug, 15:10 Water level compared to NAP: -62 cm | LAT: 192 cm |
| 4 Aug, 15:20 Water level compared to NAP: -53 cm | LAT: 201 cm |
| 4 Aug, 15:30 Water level compared to NAP: -44 cm | LAT: 211 cm |
| 4 Aug, 15:40 Water level compared to NAP: -35 cm | LAT: 221 cm |
| 4 Aug, 15:50 Water level compared to NAP: -25 cm | LAT: 231 cm |
| 4 Aug, 16:00 Water level compared to NAP: -15 cm | LAT: 242 cm |
| 4 Aug, 16:10 Water level compared to NAP: -5 cm | LAT: 254 cm |
| 4 Aug, 16:20 Water level compared to NAP: 7 cm | LAT: 267 cm |
| 4 Aug, 16:30 Water level compared to NAP: 20 cm | LAT: 281 cm |
| 4 Aug, 16:40 Water level compared to NAP: 35 cm | LAT: 298 cm |
| 4 Aug, 16:50 Water level compared to NAP: 52 cm | LAT: 317 cm |
| 4 Aug, 17:00 Water level compared to NAP: 71 cm | LAT: 339 cm |
| 4 Aug, 17:10 Water level compared to NAP: 92 cm | LAT: 362 cm |
| 4 Aug, 17:20 Water level compared to NAP: 113 cm | LAT: 387 cm |
| 4 Aug, 17:30 Water level compared to NAP: 135 cm | LAT: 412 cm |
| 4 Aug, 17:40 Water level compared to NAP: 155 cm | LAT: 433 cm |
| 4 Aug, 17:50 Water level compared to NAP: 174 cm | LAT: 450 cm |
| 4 Aug, 18:00 Water level compared to NAP: 191 cm | LAT: 463 cm |
| 4 Aug, 18:10 Water level compared to NAP: 204 cm | LAT: 471 cm |
| 4 Aug, 18:20 Water level compared to NAP: 213 cm | LAT: 475 cm |
| 4 Aug, 18:30 Water level compared to NAP: 219 cm | LAT: 476 cm |
| 4 Aug, 18:40 Water level compared to NAP: 221 cm | LAT: 475 cm |
| 4 Aug, 18:50 Water level compared to NAP: 219 cm | LAT: 471 cm |
| 4 Aug, 19:00 Water level compared to NAP: 215 cm | LAT: 466 cm |
| 4 Aug, 19:10 Water level compared to NAP: 209 cm | LAT: 460 cm |
| 4 Aug, 19:20 Water level compared to NAP: 201 cm | LAT: 453 cm |
| 4 Aug, 19:30 Water level compared to NAP: 192 cm | LAT: 445 cm |
| 4 Aug, 19:40 Water level compared to NAP: 183 cm | LAT: 436 cm |
| 4 Aug, 19:50 Water level compared to NAP: 173 cm | LAT: 428 cm |
| 4 Aug, 20:00 Water level compared to NAP: 164 cm | LAT: 419 cm |
| 4 Aug, 20:10 Water level compared to NAP: 154 cm | LAT: 410 cm |
| 4 Aug, 20:20 Water level compared to NAP: 144 cm | LAT: 399 cm |
| 4 Aug, 20:30 Water level compared to NAP: 134 cm | LAT: 388 cm |
| 4 Aug, 20:40 Water level compared to NAP: 123 cm | LAT: 377 cm |
| 4 Aug, 20:50 Water level compared to NAP: 112 cm | LAT: 365 cm |
| 4 Aug, 21:00 Water level compared to NAP: 100 cm | LAT: 352 cm |
| 4 Aug, 21:10 Water level compared to NAP: 87 cm | LAT: 337 cm |
| 4 Aug, 21:20 Water level compared to NAP: 72 cm | LAT: 323 cm |
| 4 Aug, 21:30 Water level compared to NAP: 57 cm | LAT: 307 cm |
| 4 Aug, 21:40 Water level compared to NAP: 41 cm | LAT: 290 cm |
| 4 Aug, 21:50 Water level compared to NAP: 24 cm | LAT: 274 cm |
| 4 Aug, 22:00 Water level compared to NAP: 6 cm | LAT: 258 cm |
| 4 Aug, 22:10 Water level compared to NAP: -12 cm | LAT: 241 cm |
| 4 Aug, 22:20 Water level compared to NAP: -30 cm | LAT: 227 cm |
| 4 Aug, 22:30 Water level compared to NAP: -48 cm | LAT: 211 cm |
| 4 Aug, 22:40 Water level compared to NAP: -66 cm | LAT: 195 cm |
| 4 Aug, 22:50 Water level compared to NAP: -83 cm | LAT: 181 cm |
| 4 Aug, 23:00 Water level compared to NAP: -98 cm | LAT: 167 cm |
| 4 Aug, 23:10 Water level compared to NAP: -113 cm | LAT: 153 cm |
| 4 Aug, 23:20 Water level compared to NAP: -126 cm | LAT: 141 cm |
| 4 Aug, 23:30 Water level compared to NAP: -138 cm | LAT: 129 cm |
| 4 Aug, 23:40 Water level compared to NAP: -148 cm | LAT: 117 cm |
| 4 Aug, 23:50 Water level compared to NAP: -158 cm | LAT: 106 cm |
| 5 Aug, 00:00 Water level compared to NAP: -167 cm | LAT: 97 cm |
| 5 Aug, 00:10 Water level compared to NAP: -175 cm | LAT: 86 cm |
| 5 Aug, 00:20 Water level compared to NAP: -183 cm | LAT: 78 cm |
| 5 Aug, 00:30 Water level compared to NAP: -190 cm | LAT: 70 cm |
| 5 Aug, 00:40 Water level compared to NAP: -195 cm | LAT: 63 cm |
| 5 Aug, 00:50 Water level compared to NAP: -200 cm | LAT: 59 cm |
| 5 Aug, 01:00 Water level compared to NAP: -203 cm | LAT: 56 cm |
| 5 Aug, 01:10 Water level compared to NAP: -204 cm | LAT: 54 cm |
| 5 Aug, 01:20 Water level compared to NAP: -204 cm | LAT: 54 cm |
| 5 Aug, 01:30 Water level compared to NAP: -203 cm | LAT: 57 cm |
| 5 Aug, 01:40 Water level compared to NAP: -199 cm | LAT: 60 cm |
| 5 Aug, 01:50 Water level compared to NAP: -194 cm | LAT: 65 cm |
| 5 Aug, 02:00 Water level compared to NAP: -188 cm | LAT: 72 cm |
| 5 Aug, 02:10 Water level compared to NAP: -181 cm | LAT: 80 cm |
| 5 Aug, 02:20 Water level compared to NAP: -173 cm | LAT: 87 cm |
| 5 Aug, 02:30 Water level compared to NAP: -165 cm | LAT: 95 cm |
| 5 Aug, 02:40 Water level compared to NAP: -156 cm | LAT: 103 cm |
| 5 Aug, 02:50 Water level compared to NAP: -147 cm | LAT: 110 cm |
| 5 Aug, 03:00 Water level compared to NAP: -138 cm | LAT: 118 cm |
| 5 Aug, 03:10 Water level compared to NAP: -128 cm | LAT: 126 cm |
| 5 Aug, 03:20 Water level compared to NAP: -119 cm | LAT: 135 cm |
| 5 Aug, 03:30 Water level compared to NAP: -109 cm | LAT: 145 cm |
| 3 Aug, 05:40 Water level compared to NAP: 229 cm | LAT: 482 cm |
| 3 Aug, 05:50 Water level compared to NAP: 228 cm | LAT: 481 cm |
| 3 Aug, 06:00 Water level compared to NAP: 225 cm | LAT: 478 cm |
| 3 Aug, 06:10 Water level compared to NAP: 222 cm | LAT: 475 cm |
| 3 Aug, 06:20 Water level compared to NAP: 217 cm | LAT: 470 cm |
| 3 Aug, 06:30 Water level compared to NAP: 210 cm | LAT: 463 cm |
| 3 Aug, 06:40 Water level compared to NAP: 204 cm | LAT: 457 cm |
| 3 Aug, 06:50 Water level compared to NAP: 196 cm | LAT: 449 cm |
| 3 Aug, 07:00 Water level compared to NAP: 187 cm | LAT: 440 cm |
| 3 Aug, 07:10 Water level compared to NAP: 178 cm | LAT: 431 cm |
| 3 Aug, 07:20 Water level compared to NAP: 170 cm | LAT: 423 cm |
| 3 Aug, 07:30 Water level compared to NAP: 160 cm | LAT: 413 cm |
| 3 Aug, 07:40 Water level compared to NAP: 150 cm | LAT: 403 cm |
| 3 Aug, 07:50 Water level compared to NAP: 139 cm | LAT: 392 cm |
| 3 Aug, 08:00 Water level compared to NAP: 127 cm | LAT: 380 cm |
| 3 Aug, 08:10 Water level compared to NAP: 114 cm | LAT: 367 cm |
| 3 Aug, 08:20 Water level compared to NAP: 100 cm | LAT: 353 cm |
| 3 Aug, 08:30 Water level compared to NAP: 85 cm | LAT: 338 cm |
| 3 Aug, 08:40 Water level compared to NAP: 70 cm | LAT: 323 cm |
| 3 Aug, 08:50 Water level compared to NAP: 54 cm | LAT: 307 cm |
| 3 Aug, 09:00 Water level compared to NAP: 36 cm | LAT: 289 cm |
| 3 Aug, 09:10 Water level compared to NAP: 20 cm | LAT: 273 cm |
| 3 Aug, 09:20 Water level compared to NAP: 3 cm | LAT: 256 cm |
| 3 Aug, 09:30 Water level compared to NAP: -13 cm | LAT: 240 cm |
| 3 Aug, 09:40 Water level compared to NAP: -30 cm | LAT: 223 cm |
| 3 Aug, 09:50 Water level compared to NAP: -46 cm | LAT: 207 cm |
| 3 Aug, 10:00 Water level compared to NAP: -61 cm | LAT: 192 cm |
| 3 Aug, 10:10 Water level compared to NAP: -76 cm | LAT: 177 cm |
| 3 Aug, 10:20 Water level compared to NAP: -90 cm | LAT: 163 cm |
| 3 Aug, 10:30 Water level compared to NAP: -103 cm | LAT: 150 cm |
| 3 Aug, 10:40 Water level compared to NAP: -116 cm | LAT: 137 cm |
| 3 Aug, 10:50 Water level compared to NAP: -127 cm | LAT: 126 cm |
| 3 Aug, 11:00 Water level compared to NAP: -138 cm | LAT: 115 cm |
| 3 Aug, 11:10 Water level compared to NAP: -146 cm | LAT: 107 cm |
| 3 Aug, 11:20 Water level compared to NAP: -154 cm | LAT: 99 cm |
| 3 Aug, 11:30 Water level compared to NAP: -159 cm | LAT: 94 cm |
| 3 Aug, 11:40 Water level compared to NAP: -163 cm | LAT: 90 cm |
| 3 Aug, 11:50 Water level compared to NAP: -163 cm | LAT: 90 cm |
| 3 Aug, 12:00 Water level compared to NAP: -163 cm | LAT: 90 cm |
| 3 Aug, 12:10 Water level compared to NAP: -159 cm | LAT: 94 cm |
| 3 Aug, 12:20 Water level compared to NAP: -154 cm | LAT: 99 cm |
| 3 Aug, 12:30 Water level compared to NAP: -147 cm | LAT: 106 cm |
| 3 Aug, 12:40 Water level compared to NAP: -141 cm | LAT: 112 cm |
| 3 Aug, 12:50 Water level compared to NAP: -134 cm | LAT: 119 cm |
| 3 Aug, 13:00 Water level compared to NAP: -126 cm | LAT: 127 cm |
| 3 Aug, 13:10 Water level compared to NAP: -119 cm | LAT: 134 cm |
| 3 Aug, 13:20 Water level compared to NAP: -113 cm | LAT: 140 cm |
| 3 Aug, 13:30 Water level compared to NAP: -107 cm | LAT: 146 cm |
| 3 Aug, 13:40 Water level compared to NAP: -101 cm | LAT: 152 cm |
| 3 Aug, 13:50 Water level compared to NAP: -94 cm | LAT: 159 cm |
| 3 Aug, 14:00 Water level compared to NAP: -87 cm | LAT: 166 cm |
| 3 Aug, 14:10 Water level compared to NAP: -80 cm | LAT: 173 cm |
| 3 Aug, 14:20 Water level compared to NAP: -72 cm | LAT: 181 cm |
| 3 Aug, 14:30 Water level compared to NAP: -63 cm | LAT: 190 cm |
| 3 Aug, 14:40 Water level compared to NAP: -55 cm | LAT: 198 cm |
| 3 Aug, 14:50 Water level compared to NAP: -45 cm | LAT: 208 cm |
| 3 Aug, 15:00 Water level compared to NAP: -37 cm | LAT: 216 cm |
| 3 Aug, 15:10 Water level compared to NAP: -27 cm | LAT: 226 cm |
| 3 Aug, 15:20 Water level compared to NAP: -17 cm | LAT: 236 cm |
| 3 Aug, 15:30 Water level compared to NAP: -6 cm | LAT: 247 cm |
| 3 Aug, 15:40 Water level compared to NAP: 5 cm | LAT: 258 cm |
| 3 Aug, 15:50 Water level compared to NAP: 18 cm | LAT: 271 cm |
| 3 Aug, 16:00 Water level compared to NAP: 32 cm | LAT: 285 cm |
| 3 Aug, 16:10 Water level compared to NAP: 49 cm | LAT: 302 cm |
| 3 Aug, 16:20 Water level compared to NAP: 68 cm | LAT: 321 cm |
| 3 Aug, 16:30 Water level compared to NAP: 91 cm | LAT: 344 cm |
| 3 Aug, 16:40 Water level compared to NAP: 116 cm | LAT: 369 cm |
| 3 Aug, 16:50 Water level compared to NAP: 143 cm | LAT: 396 cm |
| 3 Aug, 17:00 Water level compared to NAP: 168 cm | LAT: 421 cm |
| 3 Aug, 17:10 Water level compared to NAP: 189 cm | LAT: 442 cm |
| 3 Aug, 17:20 Water level compared to NAP: 206 cm | LAT: 459 cm |
| 3 Aug, 17:30 Water level compared to NAP: 218 cm | LAT: 471 cm |
| 3 Aug, 17:40 Water level compared to NAP: 225 cm | LAT: 478 cm |
| 3 Aug, 17:50 Water level compared to NAP: 229 cm | LAT: 482 cm |
| 3 Aug, 18:00 Water level compared to NAP: 229 cm | LAT: 482 cm |
| 3 Aug, 18:10 Water level compared to NAP: 226 cm | LAT: 479 cm |
| 3 Aug, 18:20 Water level compared to NAP: 221 cm | LAT: 474 cm |
| 3 Aug, 18:30 Water level compared to NAP: 215 cm | LAT: 468 cm |
| 3 Aug, 18:40 Water level compared to NAP: 208 cm | LAT: 461 cm |
| 3 Aug, 18:50 Water level compared to NAP: 200 cm | LAT: 453 cm |
| 3 Aug, 19:00 Water level compared to NAP: 193 cm | LAT: 446 cm |
| 3 Aug, 19:10 Water level compared to NAP: 184 cm | LAT: 437 cm |
| 3 Aug, 19:20 Water level compared to NAP: 175 cm | LAT: 428 cm |
| 3 Aug, 19:30 Water level compared to NAP: 166 cm | LAT: 419 cm |
| 3 Aug, 19:40 Water level compared to NAP: 155 cm | LAT: 408 cm |
| 3 Aug, 19:50 Water level compared to NAP: 145 cm | LAT: 398 cm |
| 3 Aug, 20:00 Water level compared to NAP: 135 cm | LAT: 388 cm |
| 3 Aug, 20:10 Water level compared to NAP: 123 cm | LAT: 376 cm |
| 3 Aug, 20:20 Water level compared to NAP: 110 cm | LAT: 363 cm |
| 3 Aug, 20:30 Water level compared to NAP: 96 cm | LAT: 349 cm |
| 3 Aug, 20:40 Water level compared to NAP: 82 cm | LAT: 335 cm |
| 3 Aug, 20:50 Water level compared to NAP: 66 cm | LAT: 319 cm |
| 3 Aug, 21:00 Water level compared to NAP: 50 cm | LAT: 303 cm |
| 3 Aug, 21:10 Water level compared to NAP: 34 cm | LAT: 287 cm |
| 3 Aug, 21:20 Water level compared to NAP: 17 cm | LAT: 270 cm |
| 3 Aug, 21:30 Water level compared to NAP: 0 cm | LAT: 253 cm |
| 3 Aug, 21:40 Water level compared to NAP: -17 cm | LAT: 236 cm |
| 3 Aug, 21:50 Water level compared to NAP: -35 cm | LAT: 218 cm |
| 3 Aug, 22:00 Water level compared to NAP: -51 cm | LAT: 202 cm |
| 3 Aug, 22:10 Water level compared to NAP: -67 cm | LAT: 186 cm |
| 3 Aug, 22:20 Water level compared to NAP: -82 cm | LAT: 171 cm |
| 3 Aug, 22:30 Water level compared to NAP: -98 cm | LAT: 155 cm |
| 3 Aug, 22:40 Water level compared to NAP: -111 cm | LAT: 142 cm |
| 3 Aug, 22:50 Water level compared to NAP: -124 cm | LAT: 129 cm |
| 3 Aug, 23:00 Water level compared to NAP: -137 cm | LAT: 116 cm |
| 3 Aug, 23:10 Water level compared to NAP: -148 cm | LAT: 105 cm |
| 3 Aug, 23:20 Water level compared to NAP: -159 cm | LAT: 94 cm |
| 3 Aug, 23:30 Water level compared to NAP: -169 cm | LAT: 84 cm |
| 3 Aug, 23:40 Water level compared to NAP: -178 cm | LAT: 75 cm |
| 3 Aug, 23:50 Water level compared to NAP: -186 cm | LAT: 67 cm |
| 4 Aug, 00:00 Water level compared to NAP: -192 cm | LAT: 61 cm |
| 4 Aug, 00:10 Water level compared to NAP: -197 cm | LAT: 56 cm |
| 4 Aug, 00:20 Water level compared to NAP: -201 cm | LAT: 52 cm |
| 4 Aug, 00:30 Water level compared to NAP: -201 cm | LAT: 52 cm |
| 4 Aug, 00:40 Water level compared to NAP: -200 cm | LAT: 53 cm |
| 4 Aug, 00:50 Water level compared to NAP: -196 cm | LAT: 57 cm |
| 4 Aug, 01:00 Water level compared to NAP: -192 cm | LAT: 61 cm |
| 4 Aug, 01:10 Water level compared to NAP: -185 cm | LAT: 68 cm |
| 4 Aug, 01:20 Water level compared to NAP: -177 cm | LAT: 76 cm |
| 4 Aug, 01:30 Water level compared to NAP: -170 cm | LAT: 83 cm |
| 4 Aug, 01:40 Water level compared to NAP: -163 cm | LAT: 90 cm |
| 4 Aug, 01:50 Water level compared to NAP: -155 cm | LAT: 98 cm |
| 4 Aug, 02:00 Water level compared to NAP: -148 cm | LAT: 105 cm |
| 4 Aug, 02:10 Water level compared to NAP: -141 cm | LAT: 112 cm |
| 4 Aug, 02:20 Water level compared to NAP: -134 cm | LAT: 119 cm |
| 4 Aug, 02:30 Water level compared to NAP: -126 cm | LAT: 127 cm |
| 4 Aug, 02:40 Water level compared to NAP: -118 cm | LAT: 135 cm |
| 4 Aug, 02:50 Water level compared to NAP: -109 cm | LAT: 144 cm |
| 4 Aug, 03:00 Water level compared to NAP: -99 cm | LAT: 154 cm |
| 4 Aug, 03:10 Water level compared to NAP: -88 cm | LAT: 165 cm |
| 4 Aug, 03:20 Water level compared to NAP: -77 cm | LAT: 176 cm |
| 4 Aug, 03:30 Water level compared to NAP: -64 cm | LAT: 189 cm |
| 4 Aug, 03:40 Water level compared to NAP: -50 cm | LAT: 203 cm |
| 4 Aug, 03:50 Water level compared to NAP: -36 cm | LAT: 217 cm |
| 4 Aug, 04:00 Water level compared to NAP: -19 cm | LAT: 234 cm |
| 4 Aug, 04:10 Water level compared to NAP: -1 cm | LAT: 252 cm |
| 4 Aug, 04:20 Water level compared to NAP: 18 cm | LAT: 271 cm |
| 4 Aug, 04:30 Water level compared to NAP: 42 cm | LAT: 295 cm |
| 4 Aug, 04:40 Water level compared to NAP: 68 cm | LAT: 321 cm |
| 4 Aug, 04:50 Water level compared to NAP: 97 cm | LAT: 350 cm |
| 4 Aug, 05:00 Water level compared to NAP: 127 cm | LAT: 380 cm |
| 4 Aug, 05:10 Water level compared to NAP: 155 cm | LAT: 408 cm |
| 4 Aug, 05:20 Water level compared to NAP: 178 cm | LAT: 431 cm |
| 4 Aug, 05:30 Water level compared to NAP: 196 cm | LAT: 449 cm |
| 4 Aug, 05:40 Water level compared to NAP: 209 cm | LAT: 462 cm |
| 4 Aug, 05:50 Water level compared to NAP: 219 cm | LAT: 472 cm |
| 4 Aug, 06:00 Water level compared to NAP: 225 cm | LAT: 478 cm |
| 4 Aug, 06:10 Water level compared to NAP: 228 cm | LAT: 481 cm |
| 4 Aug, 06:20 Water level compared to NAP: 228 cm | LAT: 481 cm |
| 4 Aug, 06:30 Water level compared to NAP: 227 cm | LAT: 480 cm |
| 4 Aug, 06:40 Water level compared to NAP: 225 cm | LAT: 478 cm |
| 4 Aug, 06:50 Water level compared to NAP: 221 cm | LAT: 474 cm |
| 4 Aug, 07:00 Water level compared to NAP: 216 cm | LAT: 469 cm |
| 4 Aug, 07:10 Water level compared to NAP: 209 cm | LAT: 462 cm |
| 4 Aug, 07:20 Water level compared to NAP: 202 cm | LAT: 455 cm |
| 4 Aug, 07:30 Water level compared to NAP: 194 cm | LAT: 447 cm |
| 4 Aug, 07:40 Water level compared to NAP: 185 cm | LAT: 438 cm |
| 4 Aug, 07:50 Water level compared to NAP: 176 cm | LAT: 429 cm |
| 4 Aug, 08:00 Water level compared to NAP: 167 cm | LAT: 420 cm |
| 4 Aug, 08:10 Water level compared to NAP: 157 cm | LAT: 410 cm |
| 4 Aug, 08:20 Water level compared to NAP: 148 cm | LAT: 401 cm |
| 4 Aug, 08:30 Water level compared to NAP: 136 cm | LAT: 389 cm |
| 4 Aug, 08:40 Water level compared to NAP: 124 cm | LAT: 377 cm |
| 4 Aug, 08:50 Water level compared to NAP: 110 cm | LAT: 363 cm |
| 4 Aug, 09:00 Water level compared to NAP: 97 cm | LAT: 350 cm |
| 4 Aug, 09:10 Water level compared to NAP: 81 cm | LAT: 334 cm |
| 4 Aug, 09:20 Water level compared to NAP: 66 cm | LAT: 319 cm |
| 4 Aug, 09:30 Water level compared to NAP: 50 cm | LAT: 303 cm |
| 4 Aug, 09:40 Water level compared to NAP: 33 cm | LAT: 286 cm |
| 4 Aug, 09:50 Water level compared to NAP: 18 cm | LAT: 271 cm |
| 4 Aug, 10:00 Water level compared to NAP: 1 cm | LAT: 254 cm |
| 4 Aug, 10:10 Water level compared to NAP: -15 cm | LAT: 238 cm |
| 4 Aug, 10:20 Water level compared to NAP: -30 cm | LAT: 223 cm |
| 4 Aug, 10:30 Water level compared to NAP: -45 cm | LAT: 208 cm |
| 4 Aug, 10:40 Water level compared to NAP: -60 cm | LAT: 193 cm |
| 4 Aug, 10:50 Water level compared to NAP: -74 cm | LAT: 179 cm |
| 4 Aug, 11:00 Water level compared to NAP: -87 cm | LAT: 166 cm |
| 4 Aug, 11:10 Water level compared to NAP: -100 cm | LAT: 153 cm |
| 4 Aug, 11:20 Water level compared to NAP: -112 cm | LAT: 141 cm |
| 4 Aug, 11:30 Water level compared to NAP: -123 cm | LAT: 130 cm |
| 4 Aug, 11:40 Water level compared to NAP: -132 cm | LAT: 121 cm |
| 4 Aug, 11:50 Water level compared to NAP: -142 cm | LAT: 111 cm |
| 4 Aug, 12:00 Water level compared to NAP: -148 cm | LAT: 105 cm |
| 4 Aug, 12:10 Water level compared to NAP: -153 cm | LAT: 100 cm |
| 4 Aug, 12:20 Water level compared to NAP: -156 cm | LAT: 97 cm |
| 4 Aug, 12:30 Water level compared to NAP: -157 cm | LAT: 96 cm |
| 4 Aug, 12:40 Water level compared to NAP: -157 cm | LAT: 96 cm |
| 4 Aug, 12:50 Water level compared to NAP: -153 cm | LAT: 100 cm |
| 4 Aug, 13:00 Water level compared to NAP: -149 cm | LAT: 104 cm |
| 4 Aug, 13:10 Water level compared to NAP: -143 cm | LAT: 110 cm |
| 4 Aug, 13:20 Water level compared to NAP: -136 cm | LAT: 117 cm |
| 4 Aug, 13:30 Water level compared to NAP: -130 cm | LAT: 123 cm |
| 4 Aug, 13:40 Water level compared to NAP: -123 cm | LAT: 130 cm |
| 4 Aug, 13:50 Water level compared to NAP: -116 cm | LAT: 137 cm |
| 4 Aug, 14:00 Water level compared to NAP: -110 cm | LAT: 143 cm |
| 4 Aug, 14:10 Water level compared to NAP: -105 cm | LAT: 148 cm |
| 4 Aug, 14:20 Water level compared to NAP: -99 cm | LAT: 154 cm |
| 4 Aug, 14:30 Water level compared to NAP: -92 cm | LAT: 161 cm |
| 4 Aug, 14:40 Water level compared to NAP: -85 cm | LAT: 168 cm |
| 4 Aug, 14:50 Water level compared to NAP: -78 cm | LAT: 175 cm |
| 4 Aug, 15:00 Water level compared to NAP: -70 cm | LAT: 183 cm |
| 4 Aug, 15:10 Water level compared to NAP: -61 cm | LAT: 192 cm |
| 4 Aug, 15:20 Water level compared to NAP: -52 cm | LAT: 201 cm |
| 4 Aug, 15:30 Water level compared to NAP: -42 cm | LAT: 211 cm |
| 4 Aug, 15:40 Water level compared to NAP: -32 cm | LAT: 221 cm |
| 4 Aug, 15:50 Water level compared to NAP: -22 cm | LAT: 231 cm |
| 4 Aug, 16:00 Water level compared to NAP: -11 cm | LAT: 242 cm |
| 4 Aug, 16:10 Water level compared to NAP: 1 cm | LAT: 254 cm |
| 4 Aug, 16:20 Water level compared to NAP: 14 cm | LAT: 267 cm |
| 4 Aug, 16:30 Water level compared to NAP: 28 cm | LAT: 281 cm |
| 4 Aug, 16:40 Water level compared to NAP: 45 cm | LAT: 298 cm |
| 4 Aug, 16:50 Water level compared to NAP: 64 cm | LAT: 317 cm |
| 4 Aug, 17:00 Water level compared to NAP: 86 cm | LAT: 339 cm |
| 4 Aug, 17:10 Water level compared to NAP: 109 cm | LAT: 362 cm |
| 4 Aug, 17:20 Water level compared to NAP: 134 cm | LAT: 387 cm |
| 4 Aug, 17:30 Water level compared to NAP: 159 cm | LAT: 412 cm |
| 4 Aug, 17:40 Water level compared to NAP: 180 cm | LAT: 433 cm |
| 4 Aug, 17:50 Water level compared to NAP: 197 cm | LAT: 450 cm |
| 4 Aug, 18:00 Water level compared to NAP: 210 cm | LAT: 463 cm |
| 4 Aug, 18:10 Water level compared to NAP: 218 cm | LAT: 471 cm |
| 4 Aug, 18:20 Water level compared to NAP: 222 cm | LAT: 475 cm |
| 4 Aug, 18:30 Water level compared to NAP: 223 cm | LAT: 476 cm |
| 4 Aug, 18:40 Water level compared to NAP: 222 cm | LAT: 475 cm |
| 4 Aug, 18:50 Water level compared to NAP: 218 cm | LAT: 471 cm |
| 4 Aug, 19:00 Water level compared to NAP: 213 cm | LAT: 466 cm |
| 4 Aug, 19:10 Water level compared to NAP: 207 cm | LAT: 460 cm |
| 4 Aug, 19:20 Water level compared to NAP: 200 cm | LAT: 453 cm |
| 4 Aug, 19:30 Water level compared to NAP: 192 cm | LAT: 445 cm |
| 4 Aug, 19:40 Water level compared to NAP: 183 cm | LAT: 436 cm |
| 4 Aug, 19:50 Water level compared to NAP: 175 cm | LAT: 428 cm |
| 4 Aug, 20:00 Water level compared to NAP: 166 cm | LAT: 419 cm |
| 4 Aug, 20:10 Water level compared to NAP: 157 cm | LAT: 410 cm |
| 4 Aug, 20:20 Water level compared to NAP: 146 cm | LAT: 399 cm |
| 4 Aug, 20:30 Water level compared to NAP: 135 cm | LAT: 388 cm |
| 4 Aug, 20:40 Water level compared to NAP: 124 cm | LAT: 377 cm |
| 4 Aug, 20:50 Water level compared to NAP: 112 cm | LAT: 365 cm |
| 4 Aug, 21:00 Water level compared to NAP: 99 cm | LAT: 352 cm |
| 4 Aug, 21:10 Water level compared to NAP: 84 cm | LAT: 337 cm |
| 4 Aug, 21:20 Water level compared to NAP: 70 cm | LAT: 323 cm |
| 4 Aug, 21:30 Water level compared to NAP: 54 cm | LAT: 307 cm |
| 4 Aug, 21:40 Water level compared to NAP: 37 cm | LAT: 290 cm |
| 4 Aug, 21:50 Water level compared to NAP: 21 cm | LAT: 274 cm |
| 4 Aug, 22:00 Water level compared to NAP: 5 cm | LAT: 258 cm |
| 4 Aug, 22:10 Water level compared to NAP: -12 cm | LAT: 241 cm |
| 4 Aug, 22:20 Water level compared to NAP: -26 cm | LAT: 227 cm |
| 4 Aug, 22:30 Water level compared to NAP: -42 cm | LAT: 211 cm |
| 4 Aug, 22:40 Water level compared to NAP: -58 cm | LAT: 195 cm |
| 4 Aug, 22:50 Water level compared to NAP: -72 cm | LAT: 181 cm |
| 4 Aug, 23:00 Water level compared to NAP: -86 cm | LAT: 167 cm |
| 4 Aug, 23:10 Water level compared to NAP: -100 cm | LAT: 153 cm |
| 4 Aug, 23:20 Water level compared to NAP: -112 cm | LAT: 141 cm |
| 4 Aug, 23:30 Water level compared to NAP: -124 cm | LAT: 129 cm |
| 4 Aug, 23:40 Water level compared to NAP: -136 cm | LAT: 117 cm |
| 4 Aug, 23:50 Water level compared to NAP: -147 cm | LAT: 106 cm |
| 5 Aug, 00:00 Water level compared to NAP: -156 cm | LAT: 97 cm |
| 5 Aug, 00:10 Water level compared to NAP: -167 cm | LAT: 86 cm |
| 5 Aug, 00:20 Water level compared to NAP: -175 cm | LAT: 78 cm |
| 5 Aug, 00:30 Water level compared to NAP: -183 cm | LAT: 70 cm |
| 5 Aug, 00:40 Water level compared to NAP: -190 cm | LAT: 63 cm |
| 5 Aug, 00:50 Water level compared to NAP: -194 cm | LAT: 59 cm |
| 5 Aug, 01:00 Water level compared to NAP: -197 cm | LAT: 56 cm |
| 5 Aug, 01:10 Water level compared to NAP: -199 cm | LAT: 54 cm |
| 5 Aug, 01:20 Water level compared to NAP: -199 cm | LAT: 54 cm |
| 5 Aug, 01:30 Water level compared to NAP: -196 cm | LAT: 57 cm |
| 5 Aug, 01:40 Water level compared to NAP: -193 cm | LAT: 60 cm |
| 5 Aug, 01:50 Water level compared to NAP: -188 cm | LAT: 65 cm |
| 5 Aug, 02:00 Water level compared to NAP: -181 cm | LAT: 72 cm |
| 5 Aug, 02:10 Water level compared to NAP: -173 cm | LAT: 80 cm |
| 5 Aug, 02:20 Water level compared to NAP: -166 cm | LAT: 87 cm |
| 5 Aug, 02:30 Water level compared to NAP: -158 cm | LAT: 95 cm |
| 5 Aug, 02:40 Water level compared to NAP: -150 cm | LAT: 103 cm |
| 5 Aug, 02:50 Water level compared to NAP: -143 cm | LAT: 110 cm |
| 5 Aug, 03:00 Water level compared to NAP: -135 cm | LAT: 118 cm |
| 5 Aug, 03:10 Water level compared to NAP: -127 cm | LAT: 126 cm |
| 5 Aug, 03:20 Water level compared to NAP: -118 cm | LAT: 135 cm |
| 5 Aug, 03:30 Water level compared to NAP: -108 cm | LAT: 145 cm |
Tide curve Vlissingen
The graph above shows the progression of the tide at Vlissingen see. The blue line follows the astronomical tide forecast in NAP, which is the data that you also see in the table on the left in the '10 min' column. The orange line, however, shows the astronomical forecast plus - or minus - the setup. The influences of the weather and current are therefore included, so that the orange line represents the most likely scenario. About the reference planes (NAP and LAT)
Most of the tide data you see here is shown relative to NAP (Normal Amsterdam Level). However, the measuring stations Aukfield, Europlatform, K13A and the Lichteiland Goeree give their values in MSL, Mean Sea Level, which represents the average sea level. LAT is an international reference plane and stands for Lowest Astronomical Tide. It is used as a reference plane for water depths on nautical charts. If you use this, it is best to maintain this level. LAT represents the lowest possible tide at a given location, which is only reached at highly exceptional times. Normally the water level will therefore always be above it.
A standard difference between NAP and LAT is known for each tidal location, the standard difference between NAP and LAT at Vlissingen is: 253 cm
Want to know more? The Wadvaarders Foundation has an interesting explanation about LAT vs. NAP on its website.
Overview of measuring stations
Map of the Netherlands