Current water level
Water level compared to LAT: 219 cm
Measurement time: 23:50 uur
On the water map
Choose your tide station
Download the app
With the The Tides app you have the current tide data at hand anytime, anywhere.
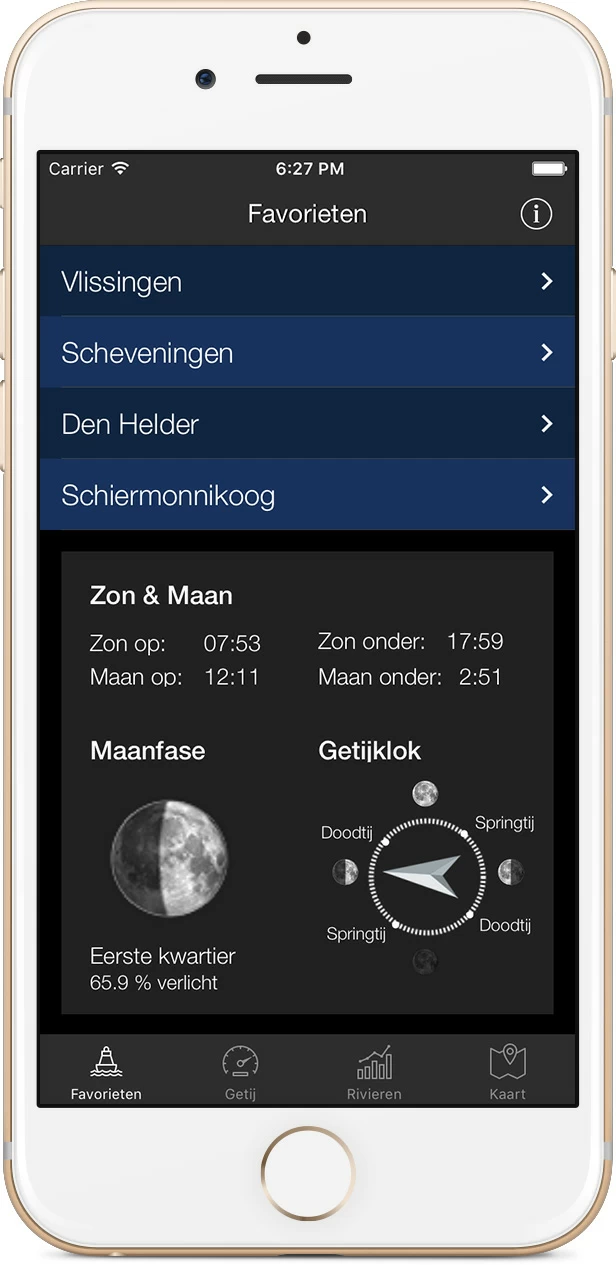
Download the app for iOS or Android.
The tide ahead Bergsediepsluis
| 27 June High water at 02:43 Water level compared to NAP: 153 cm | LAT: 361 cm |
| 27 June Low water at 08:46 Water level compared to NAP: -150 cm | LAT: 58 cm |
| 27 June High water at 15:12 Water level compared to NAP: 162 cm | LAT: 370 cm |
| 27 June Low water at 21:14 Water level compared to NAP: -145 cm | LAT: 63 cm |
| 28 June High water at 03:34 Water level compared to NAP: 160 cm | LAT: 368 cm |
| 28 June Low water at 09:33 Water level compared to NAP: -144 cm | LAT: 64 cm |
| 28 June High water at 15:57 Water level compared to NAP: 165 cm | LAT: 373 cm |
| 28 June Low water at 21:58 Water level compared to NAP: -151 cm | LAT: 57 cm |
| 29 June High water at 04:17 Water level compared to NAP: 166 cm | LAT: 374 cm |
| 29 June Low water at 10:13 Water level compared to NAP: -139 cm | LAT: 69 cm |
| 29 June High water at 16:36 Water level compared to NAP: 168 cm | LAT: 376 cm |
| 29 June Low water at 22:37 Water level compared to NAP: -155 cm | LAT: 53 cm |
| 30 June High water at 04:56 Water level compared to NAP: 172 cm | LAT: 380 cm |
| 30 June Low water at 10:49 Water level compared to NAP: -135 cm | LAT: 73 cm |
| 30 June High water at 17:11 Water level compared to NAP: 171 cm | LAT: 379 cm |
| 30 June Low water at 23:15 Water level compared to NAP: -160 cm | LAT: 48 cm |
| 1 July High water at 05:32 Water level compared to NAP: 178 cm | LAT: 386 cm |
| 1 July Low water at 11:25 Water level compared to NAP: -133 cm | LAT: 75 cm |
| 1 July High water at 17:45 Water level compared to NAP: 175 cm | LAT: 383 cm |
| 1 July Low water at 23:52 Water level compared to NAP: -165 cm | LAT: 43 cm |
| 2 July High water at 06:08 Water level compared to NAP: 182 cm | LAT: 390 cm |
| 2 July Low water at 12:00 Water level compared to NAP: -132 cm | LAT: 76 cm |
| 2 July High water at 18:19 Water level compared to NAP: 177 cm | LAT: 385 cm |
| 3 July Low water at 00:28 Water level compared to NAP: -169 cm | LAT: 39 cm |
| 3 July High water at 06:44 Water level compared to NAP: 183 cm | LAT: 391 cm |
| 3 July Low water at 12:35 Water level compared to NAP: -131 cm | LAT: 77 cm |
| 3 July High water at 18:53 Water level compared to NAP: 175 cm | LAT: 383 cm |
| 4 July Low water at 01:04 Water level compared to NAP: -172 cm | LAT: 36 cm |
| 4 July High water at 07:19 Water level compared to NAP: 181 cm | LAT: 389 cm |
| 4 July Low water at 13:11 Water level compared to NAP: -130 cm | LAT: 78 cm |
| 4 July High water at 19:27 Water level compared to NAP: 172 cm | LAT: 380 cm |
| 5 July Low water at 01:40 Water level compared to NAP: -174 cm | LAT: 34 cm |
| 5 July High water at 07:54 Water level compared to NAP: 177 cm | LAT: 385 cm |
| 5 July Low water at 13:47 Water level compared to NAP: -128 cm | LAT: 80 cm |
| 5 July High water at 20:04 Water level compared to NAP: 168 cm | LAT: 376 cm |
| 6 July Low water at 02:17 Water level compared to NAP: -175 cm | LAT: 33 cm |
| 6 July High water at 08:33 Water level compared to NAP: 174 cm | LAT: 382 cm |
| 6 July Low water at 14:27 Water level compared to NAP: -128 cm | LAT: 80 cm |
| 6 July High water at 20:46 Water level compared to NAP: 165 cm | LAT: 373 cm |
| 7 July Low water at 02:58 Water level compared to NAP: -176 cm | LAT: 32 cm |
| 7 July High water at 09:19 Water level compared to NAP: 170 cm | LAT: 378 cm |
| 7 July Low water at 15:11 Water level compared to NAP: -129 cm | LAT: 79 cm |
| No astronomical forecast available |
| No setup expectation available |
Tide curve Bergsediepsluis
The graph above shows the progression of the tide at Bergsediepsluis see. The blue line follows the astronomical tide forecast in NAP, which is the data that you also see in the table on the left in the '10 min' column. The orange line, however, shows the astronomical forecast plus - or minus - the setup. The influences of the weather and current are therefore included, so that the orange line represents the most likely scenario. About the reference planes (NAP and LAT)
Most of the tide data you see here is shown relative to NAP (Normal Amsterdam Level). However, the measuring stations Aukfield, Europlatform, K13A and the Lichteiland Goeree give their values in MSL, Mean Sea Level, which represents the average sea level. LAT is an international reference plane and stands for Lowest Astronomical Tide. It is used as a reference plane for water depths on nautical charts. If you use this, it is best to maintain this level. LAT represents the lowest possible tide at a given location, which is only reached at highly exceptional times. Normally the water level will therefore always be above it.
A standard difference between NAP and LAT is known for each tidal location, the standard difference between NAP and LAT at Bergsediepsluis is: 204 cm
Want to know more? The Wadvaarders Foundation has an interesting explanation about LAT vs. NAP on its website.
Overview of measuring stations
Map of the Netherlands