Current water level
Water level compared to LAT: 418 cm
Measurement time: 16:20 uur
On the water map
Choose your tide station
Download the app
With the The Tides app you have the current tide data at hand anytime, anywhere.
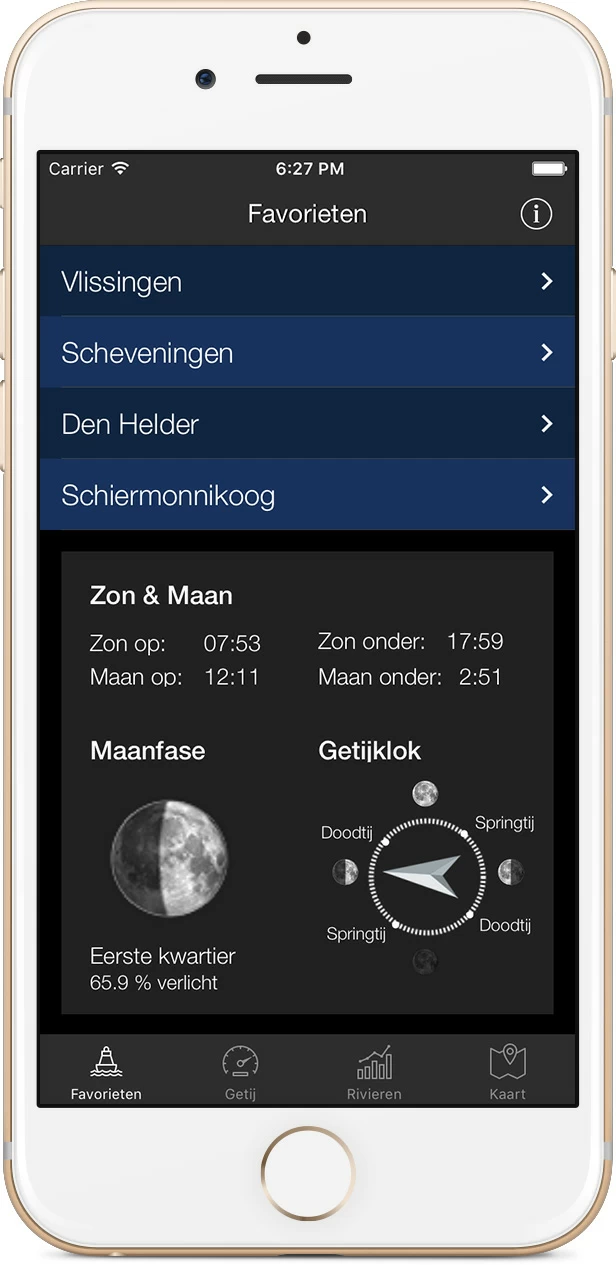
Download the app for iOS or Android.
The tide ahead Bath
| 26 July High water at 01:55 Water level compared to NAP: 204 cm | LAT: 499 cm |
| 26 July Low water at 08:10 Water level compared to NAP: -176 cm | LAT: 119 cm |
| 26 July High water at 14:28 Water level compared to NAP: 213 cm | LAT: 508 cm |
| 26 July Low water at 20:45 Water level compared to NAP: -180 cm | LAT: 115 cm |
| 27 July High water at 02:53 Water level compared to NAP: 226 cm | LAT: 521 cm |
| 27 July Low water at 09:05 Water level compared to NAP: -183 cm | LAT: 112 cm |
| 27 July High water at 15:18 Water level compared to NAP: 234 cm | LAT: 529 cm |
| 27 July Low water at 21:37 Water level compared to NAP: -197 cm | LAT: 98 cm |
| 28 July High water at 03:39 Water level compared to NAP: 248 cm | LAT: 543 cm |
| 28 July Low water at 09:50 Water level compared to NAP: -188 cm | LAT: 107 cm |
| 28 July High water at 15:59 Water level compared to NAP: 252 cm | LAT: 547 cm |
| 28 July Low water at 22:21 Water level compared to NAP: -210 cm | LAT: 85 cm |
| 29 July High water at 04:18 Water level compared to NAP: 267 cm | LAT: 562 cm |
| 29 July Low water at 10:31 Water level compared to NAP: -192 cm | LAT: 103 cm |
| 29 July High water at 16:35 Water level compared to NAP: 267 cm | LAT: 562 cm |
| 29 July Low water at 23:01 Water level compared to NAP: -221 cm | LAT: 74 cm |
| 30 July High water at 04:53 Water level compared to NAP: 282 cm | LAT: 577 cm |
| 30 July Low water at 11:08 Water level compared to NAP: -195 cm | LAT: 100 cm |
| 30 July High water at 17:09 Water level compared to NAP: 280 cm | LAT: 575 cm |
| 30 July Low water at 23:39 Water level compared to NAP: -232 cm | LAT: 63 cm |
| 31 July High water at 05:26 Water level compared to NAP: 294 cm | LAT: 589 cm |
| 31 July Low water at 11:45 Water level compared to NAP: -199 cm | LAT: 96 cm |
| 31 July High water at 17:42 Water level compared to NAP: 289 cm | LAT: 584 cm |
| 1 August Low water at 00:17 Water level compared to NAP: -242 cm | LAT: 53 cm |
| 1 August High water at 05:59 Water level compared to NAP: 302 cm | LAT: 597 cm |
| 1 August Low water at 12:21 Water level compared to NAP: -202 cm | LAT: 93 cm |
| 1 August High water at 18:15 Water level compared to NAP: 293 cm | LAT: 588 cm |
| 2 August Low water at 00:54 Water level compared to NAP: -248 cm | LAT: 47 cm |
| 2 August High water at 06:32 Water level compared to NAP: 303 cm | LAT: 598 cm |
| 2 August Low water at 12:56 Water level compared to NAP: -204 cm | LAT: 91 cm |
| 2 August High water at 18:48 Water level compared to NAP: 291 cm | LAT: 586 cm |
| 3 August Low water at 01:30 Water level compared to NAP: -248 cm | LAT: 47 cm |
| 3 August High water at 07:06 Water level compared to NAP: 300 cm | LAT: 595 cm |
| 3 August Low water at 13:31 Water level compared to NAP: -204 cm | LAT: 91 cm |
| 3 August High water at 19:23 Water level compared to NAP: 288 cm | LAT: 583 cm |
| 4 August Low water at 02:05 Water level compared to NAP: -245 cm | LAT: 50 cm |
| 4 August High water at 07:43 Water level compared to NAP: 293 cm | LAT: 588 cm |
| 4 August Low water at 14:06 Water level compared to NAP: -205 cm | LAT: 90 cm |
| 4 August High water at 20:01 Water level compared to NAP: 284 cm | LAT: 579 cm |
| 5 August Low water at 02:41 Water level compared to NAP: -241 cm | LAT: 54 cm |
| 5 August High water at 08:25 Water level compared to NAP: 282 cm | LAT: 577 cm |
| 5 August Low water at 14:45 Water level compared to NAP: -205 cm | LAT: 90 cm |
| 26 Jul, 15:40 Water level compared to NAP: 164 cm | LAT: 464 cm |
| 26 Jul, 15:50 Water level compared to NAP: 152 cm | LAT: 451 cm |
| 26 Jul, 16:00 Water level compared to NAP: 138 cm | LAT: 439 cm |
| 26 Jul, 16:10 Water level compared to NAP: 124 cm | LAT: 426 cm |
| 26 Jul, 16:20 Water level compared to NAP: 110 cm | LAT: 414 cm |
| 26 Jul, 16:30 Water level compared to NAP: 95 cm | LAT: 402 cm |
| 26 Jul, 16:40 Water level compared to NAP: 80 cm | LAT: 390 cm |
| 26 Jul, 16:50 Water level compared to NAP: 66 cm | LAT: 377 cm |
| 26 Jul, 17:00 Water level compared to NAP: 51 cm | LAT: 364 cm |
| 26 Jul, 17:10 Water level compared to NAP: 36 cm | LAT: 351 cm |
| 26 Jul, 17:20 Water level compared to NAP: 23 cm | LAT: 337 cm |
| 26 Jul, 17:30 Water level compared to NAP: 9 cm | LAT: 322 cm |
| 26 Jul, 17:40 Water level compared to NAP: -4 cm | LAT: 308 cm |
| 26 Jul, 17:50 Water level compared to NAP: -17 cm | LAT: 295 cm |
| 26 Jul, 18:00 Water level compared to NAP: -30 cm | LAT: 280 cm |
| 26 Jul, 18:10 Water level compared to NAP: -42 cm | LAT: 266 cm |
| 26 Jul, 18:20 Water level compared to NAP: -55 cm | LAT: 252 cm |
| 26 Jul, 18:30 Water level compared to NAP: -68 cm | LAT: 239 cm |
| 26 Jul, 18:40 Water level compared to NAP: -80 cm | LAT: 227 cm |
| 26 Jul, 18:50 Water level compared to NAP: -93 cm | LAT: 214 cm |
| 26 Jul, 19:00 Water level compared to NAP: -105 cm | LAT: 203 cm |
| 26 Jul, 19:10 Water level compared to NAP: -117 cm | LAT: 193 cm |
| 26 Jul, 19:20 Water level compared to NAP: -129 cm | LAT: 182 cm |
| 26 Jul, 19:30 Water level compared to NAP: -139 cm | LAT: 173 cm |
| 26 Jul, 19:40 Water level compared to NAP: -149 cm | LAT: 165 cm |
| 26 Jul, 19:50 Water level compared to NAP: -157 cm | LAT: 158 cm |
| 26 Jul, 20:00 Water level compared to NAP: -165 cm | LAT: 151 cm |
| 26 Jul, 20:10 Water level compared to NAP: -171 cm | LAT: 145 cm |
| 26 Jul, 20:20 Water level compared to NAP: -175 cm | LAT: 140 cm |
| 26 Jul, 20:30 Water level compared to NAP: -178 cm | LAT: 136 cm |
| 26 Jul, 20:40 Water level compared to NAP: -180 cm | LAT: 133 cm |
| 26 Jul, 20:50 Water level compared to NAP: -180 cm | LAT: 134 cm |
| 26 Jul, 21:00 Water level compared to NAP: -178 cm | LAT: 135 cm |
| 26 Jul, 21:10 Water level compared to NAP: -175 cm | LAT: 139 cm |
| 26 Jul, 21:20 Water level compared to NAP: -170 cm | LAT: 146 cm |
| 26 Jul, 21:30 Water level compared to NAP: -163 cm | LAT: 155 cm |
| 26 Jul, 21:40 Water level compared to NAP: -155 cm | LAT: 165 cm |
| 26 Jul, 21:50 Water level compared to NAP: -146 cm | LAT: 176 cm |
| 26 Jul, 22:00 Water level compared to NAP: -136 cm | LAT: 190 cm |
| 26 Jul, 22:10 Water level compared to NAP: -125 cm | LAT: 203 cm |
| 26 Jul, 22:20 Water level compared to NAP: -114 cm | LAT: 217 cm |
| 26 Jul, 22:30 Water level compared to NAP: -102 cm | LAT: 231 cm |
| 26 Jul, 22:40 Water level compared to NAP: -90 cm | LAT: 244 cm |
| 26 Jul, 22:50 Water level compared to NAP: -78 cm | LAT: 257 cm |
| 26 Jul, 23:00 Water level compared to NAP: -66 cm | LAT: 270 cm |
| 26 Jul, 23:10 Water level compared to NAP: -54 cm | LAT: 283 cm |
| 26 Jul, 23:20 Water level compared to NAP: -41 cm | LAT: 295 cm |
| 26 Jul, 23:30 Water level compared to NAP: -28 cm | LAT: 307 cm |
| 26 Jul, 23:40 Water level compared to NAP: -14 cm | LAT: 320 cm |
| 26 Jul, 23:50 Water level compared to NAP: -1 cm | LAT: 334 cm |
| 27 Jul, 00:00 Water level compared to NAP: 14 cm | LAT: 347 cm |
| 27 Jul, 00:10 Water level compared to NAP: 29 cm | LAT: 362 cm |
| 27 Jul, 00:20 Water level compared to NAP: 44 cm | LAT: 376 cm |
| 27 Jul, 00:30 Water level compared to NAP: 59 cm | LAT: 392 cm |
| 27 Jul, 00:40 Water level compared to NAP: 75 cm | LAT: 409 cm |
| 27 Jul, 00:50 Water level compared to NAP: 91 cm | LAT: 427 cm |
| 27 Jul, 01:00 Water level compared to NAP: 107 cm | LAT: 448 cm |
| 27 Jul, 01:10 Water level compared to NAP: 123 cm | LAT: 466 cm |
| 27 Jul, 01:20 Water level compared to NAP: 139 cm | LAT: 488 cm |
| 27 Jul, 01:30 Water level compared to NAP: 154 cm | LAT: 508 cm |
| 27 Jul, 01:40 Water level compared to NAP: 169 cm | LAT: 524 cm |
| 27 Jul, 01:50 Water level compared to NAP: 183 cm | LAT: 541 cm |
| 27 Jul, 02:00 Water level compared to NAP: 195 cm | LAT: 552 cm |
| 27 Jul, 02:10 Water level compared to NAP: 205 cm | LAT: 562 cm |
| 27 Jul, 02:20 Water level compared to NAP: 214 cm | LAT: 567 cm |
| 27 Jul, 02:30 Water level compared to NAP: 220 cm | LAT: 568 cm |
| 27 Jul, 02:40 Water level compared to NAP: 224 cm | LAT: 570 cm |
| 27 Jul, 02:50 Water level compared to NAP: 226 cm | LAT: 569 cm |
| 27 Jul, 03:00 Water level compared to NAP: 226 cm | LAT: 566 cm |
| 27 Jul, 03:10 Water level compared to NAP: 223 cm | LAT: 561 cm |
| 27 Jul, 03:20 Water level compared to NAP: 218 cm | LAT: 553 cm |
| 27 Jul, 03:30 Water level compared to NAP: 212 cm | LAT: 544 cm |
| 27 Jul, 03:40 Water level compared to NAP: 204 cm | LAT: 534 cm |
| 27 Jul, 03:50 Water level compared to NAP: 194 cm | LAT: 522 cm |
| 27 Jul, 04:00 Water level compared to NAP: 184 cm | LAT: 509 cm |
| 27 Jul, 04:10 Water level compared to NAP: 172 cm | LAT: 497 cm |
| 27 Jul, 04:20 Water level compared to NAP: 160 cm | LAT: 484 cm |
| 27 Jul, 04:30 Water level compared to NAP: 146 cm | LAT: 470 cm |
| 27 Jul, 04:40 Water level compared to NAP: 132 cm | LAT: 457 cm |
| 27 Jul, 04:50 Water level compared to NAP: 118 cm | LAT: 445 cm |
| 27 Jul, 05:00 Water level compared to NAP: 103 cm | LAT: 431 cm |
| 27 Jul, 05:10 Water level compared to NAP: 88 cm | LAT: 418 cm |
| 27 Jul, 05:20 Water level compared to NAP: 74 cm | LAT: 404 cm |
| 27 Jul, 05:30 Water level compared to NAP: 59 cm | LAT: 390 cm |
| 27 Jul, 05:40 Water level compared to NAP: 44 cm | LAT: 374 cm |
| 27 Jul, 05:50 Water level compared to NAP: 30 cm | LAT: 360 cm |
| 27 Jul, 06:00 Water level compared to NAP: 16 cm | LAT: 344 cm |
| 27 Jul, 06:10 Water level compared to NAP: 1 cm | LAT: 328 cm |
| 27 Jul, 06:20 Water level compared to NAP: -13 cm | LAT: 312 cm |
| 27 Jul, 06:30 Water level compared to NAP: -27 cm | LAT: 297 cm |
| 27 Jul, 06:40 Water level compared to NAP: -42 cm | LAT: 280 cm |
| 27 Jul, 06:50 Water level compared to NAP: -56 cm | LAT: 266 cm |
| 27 Jul, 07:00 Water level compared to NAP: -70 cm | LAT: 251 cm |
| 27 Jul, 07:10 Water level compared to NAP: -85 cm | LAT: 236 cm |
| 27 Jul, 07:20 Water level compared to NAP: -98 cm | LAT: 223 cm |
| 27 Jul, 07:30 Water level compared to NAP: -111 cm | LAT: 210 cm |
| 27 Jul, 07:40 Water level compared to NAP: -124 cm | LAT: 198 cm |
| 27 Jul, 07:50 Water level compared to NAP: -136 cm | LAT: 186 cm |
| 27 Jul, 08:00 Water level compared to NAP: -146 cm | LAT: 176 cm |
| 27 Jul, 08:10 Water level compared to NAP: -156 cm | LAT: 165 cm |
| 27 Jul, 08:20 Water level compared to NAP: -164 cm | LAT: 156 cm |
| 27 Jul, 08:30 Water level compared to NAP: -171 cm | LAT: 149 cm |
| 27 Jul, 08:40 Water level compared to NAP: -177 cm | LAT: 142 cm |
| 27 Jul, 08:50 Water level compared to NAP: -181 cm | LAT: 138 cm |
| 27 Jul, 09:00 Water level compared to NAP: -182 cm | LAT: 135 cm |
| 27 Jul, 09:10 Water level compared to NAP: -182 cm | LAT: 135 cm |
| 27 Jul, 09:20 Water level compared to NAP: -180 cm | LAT: 139 cm |
| 27 Jul, 09:30 Water level compared to NAP: -176 cm | LAT: 144 cm |
| 27 Jul, 09:40 Water level compared to NAP: -170 cm | LAT: 152 cm |
| 27 Jul, 09:50 Water level compared to NAP: -162 cm | LAT: 164 cm |
| 27 Jul, 10:00 Water level compared to NAP: -153 cm | LAT: 175 cm |
| 27 Jul, 10:10 Water level compared to NAP: -143 cm | LAT: 188 cm |
| 27 Jul, 10:20 Water level compared to NAP: -132 cm | LAT: 202 cm |
| 27 Jul, 10:30 Water level compared to NAP: -120 cm | LAT: 215 cm |
| 27 Jul, 10:40 Water level compared to NAP: -109 cm | LAT: 229 cm |
| 27 Jul, 10:50 Water level compared to NAP: -97 cm | LAT: 242 cm |
| 27 Jul, 11:00 Water level compared to NAP: -86 cm | LAT: 255 cm |
| 27 Jul, 11:10 Water level compared to NAP: -74 cm | LAT: 267 cm |
| 27 Jul, 11:20 Water level compared to NAP: -62 cm | LAT: 279 cm |
| 27 Jul, 11:30 Water level compared to NAP: -51 cm | LAT: 290 cm |
| 27 Jul, 11:40 Water level compared to NAP: -39 cm | LAT: 301 cm |
| 27 Jul, 11:50 Water level compared to NAP: -26 cm | LAT: 312 cm |
| 27 Jul, 12:00 Water level compared to NAP: -13 cm | LAT: 323 cm |
| 27 Jul, 12:10 Water level compared to NAP: 0 cm | LAT: 334 cm |
| 27 Jul, 12:20 Water level compared to NAP: 14 cm | LAT: 345 cm |
| 27 Jul, 12:30 Water level compared to NAP: 28 cm | LAT: 357 cm |
| 27 Jul, 12:40 Water level compared to NAP: 43 cm | LAT: 369 cm |
| 27 Jul, 12:50 Water level compared to NAP: 58 cm | LAT: 381 cm |
| 27 Jul, 13:00 Water level compared to NAP: 73 cm | LAT: 396 cm |
| 27 Jul, 13:10 Water level compared to NAP: 89 cm | LAT: 411 cm |
| 27 Jul, 13:20 Water level compared to NAP: 105 cm | LAT: 425 cm |
| 27 Jul, 13:30 Water level compared to NAP: 121 cm | LAT: 444 cm |
| 27 Jul, 13:40 Water level compared to NAP: 136 cm | LAT: 463 cm |
| 27 Jul, 13:50 Water level compared to NAP: 152 cm | LAT: 480 cm |
| 27 Jul, 14:00 Water level compared to NAP: 167 cm | LAT: 500 cm |
| 27 Jul, 14:10 Water level compared to NAP: 181 cm | LAT: 518 cm |
| 27 Jul, 14:20 Water level compared to NAP: 195 cm | LAT: 532 cm |
| 27 Jul, 14:30 Water level compared to NAP: 207 cm | LAT: 543 cm |
| 27 Jul, 14:40 Water level compared to NAP: 217 cm | LAT: 550 cm |
| 27 Jul, 14:50 Water level compared to NAP: 224 cm | LAT: 556 cm |
| 27 Jul, 15:00 Water level compared to NAP: 230 cm | LAT: 557 cm |
| 27 Jul, 15:10 Water level compared to NAP: 233 cm | LAT: 557 cm |
| 27 Jul, 15:20 Water level compared to NAP: 234 cm | LAT: 554 cm |
| 27 Jul, 15:30 Water level compared to NAP: 233 cm | LAT: 550 cm |
| 27 Jul, 15:40 Water level compared to NAP: 229 cm | LAT: 542 cm |
| 27 Jul, 15:50 Water level compared to NAP: 223 cm | LAT: 532 cm |
| 27 Jul, 16:00 Water level compared to NAP: 215 cm | LAT: 521 cm |
| 27 Jul, 16:10 Water level compared to NAP: 205 cm | LAT: 509 cm |
| 27 Jul, 16:20 Water level compared to NAP: 194 cm | LAT: 495 cm |
| 27 Jul, 16:30 Water level compared to NAP: 182 cm | LAT: 482 cm |
| 27 Jul, 16:40 Water level compared to NAP: 169 cm | LAT: 467 cm |
| 27 Jul, 16:50 Water level compared to NAP: 155 cm | LAT: 453 cm |
| 27 Jul, 17:00 Water level compared to NAP: 140 cm | LAT: 439 cm |
| 27 Jul, 17:10 Water level compared to NAP: 125 cm | LAT: 425 cm |
| 27 Jul, 17:20 Water level compared to NAP: 110 cm | LAT: 412 cm |
| 27 Jul, 17:30 Water level compared to NAP: 95 cm | LAT: 398 cm |
| 27 Jul, 17:40 Water level compared to NAP: 80 cm | LAT: 384 cm |
| 27 Jul, 17:50 Water level compared to NAP: 66 cm | LAT: 369 cm |
| 27 Jul, 18:00 Water level compared to NAP: 51 cm | LAT: 354 cm |
| 27 Jul, 18:10 Water level compared to NAP: 37 cm | LAT: 338 cm |
| 27 Jul, 18:20 Water level compared to NAP: 22 cm | LAT: 322 cm |
| 27 Jul, 18:30 Water level compared to NAP: 8 cm | LAT: 306 cm |
| 27 Jul, 18:40 Water level compared to NAP: -6 cm | LAT: 290 cm |
| 27 Jul, 18:50 Water level compared to NAP: -21 cm | LAT: 273 cm |
| 27 Jul, 19:00 Water level compared to NAP: -35 cm | LAT: 258 cm |
| 27 Jul, 19:10 Water level compared to NAP: -50 cm | LAT: 242 cm |
| 27 Jul, 19:20 Water level compared to NAP: -64 cm | LAT: 227 cm |
| 27 Jul, 19:30 Water level compared to NAP: -79 cm | LAT: 212 cm |
| 27 Jul, 19:40 Water level compared to NAP: -93 cm | LAT: 198 cm |
| 27 Jul, 19:50 Water level compared to NAP: -107 cm | LAT: 184 cm |
| 27 Jul, 20:00 Water level compared to NAP: -121 cm | LAT: 171 cm |
| 27 Jul, 20:10 Water level compared to NAP: -134 cm | LAT: 158 cm |
| 27 Jul, 20:20 Water level compared to NAP: -146 cm | LAT: 147 cm |
| 27 Jul, 20:30 Water level compared to NAP: -157 cm | LAT: 136 cm |
| 27 Jul, 20:40 Water level compared to NAP: -167 cm | LAT: 126 cm |
| 27 Jul, 20:50 Water level compared to NAP: -176 cm | LAT: 118 cm |
| 27 Jul, 21:00 Water level compared to NAP: -184 cm | LAT: 110 cm |
| 27 Jul, 21:10 Water level compared to NAP: -189 cm | LAT: 102 cm |
| 27 Jul, 21:20 Water level compared to NAP: -194 cm | LAT: 97 cm |
| 27 Jul, 21:30 Water level compared to NAP: -196 cm | LAT: 93 cm |
| 27 Jul, 21:40 Water level compared to NAP: -197 cm | LAT: 91 cm |
| 27 Jul, 21:50 Water level compared to NAP: -195 cm | LAT: 92 cm |
| 27 Jul, 22:00 Water level compared to NAP: -191 cm | LAT: 95 cm |
| 27 Jul, 22:10 Water level compared to NAP: -186 cm | LAT: 100 cm |
| 27 Jul, 22:20 Water level compared to NAP: -179 cm | LAT: 111 cm |
| 27 Jul, 22:30 Water level compared to NAP: -171 cm | LAT: 121 cm |
| 27 Jul, 22:40 Water level compared to NAP: -161 cm | LAT: 134 cm |
| 27 Jul, 22:50 Water level compared to NAP: -150 cm | LAT: 147 cm |
| 27 Jul, 23:00 Water level compared to NAP: -139 cm | LAT: 161 cm |
| 27 Jul, 23:10 Water level compared to NAP: -127 cm | LAT: 175 cm |
| 27 Jul, 23:20 Water level compared to NAP: -115 cm | LAT: 189 cm |
| 27 Jul, 23:30 Water level compared to NAP: -103 cm | LAT: 203 cm |
| 27 Jul, 23:40 Water level compared to NAP: -91 cm | LAT: 218 cm |
| 27 Jul, 23:50 Water level compared to NAP: -78 cm | LAT: 230 cm |
| 28 Jul, 00:00 Water level compared to NAP: -66 cm | LAT: 244 cm |
| 28 Jul, 00:10 Water level compared to NAP: -53 cm | LAT: 257 cm |
| 28 Jul, 00:20 Water level compared to NAP: -39 cm | LAT: 269 cm |
| 28 Jul, 00:30 Water level compared to NAP: -25 cm | LAT: 282 cm |
| 28 Jul, 00:40 Water level compared to NAP: -11 cm | LAT: 295 cm |
| 28 Jul, 00:50 Water level compared to NAP: 4 cm | LAT: 309 cm |
| 28 Jul, 01:00 Water level compared to NAP: 20 cm | LAT: 324 cm |
| 28 Jul, 01:10 Water level compared to NAP: 36 cm | LAT: 340 cm |
| 28 Jul, 01:20 Water level compared to NAP: 54 cm | LAT: 357 cm |
| 28 Jul, 01:30 Water level compared to NAP: 72 cm | LAT: 376 cm |
| 28 Jul, 01:40 Water level compared to NAP: 92 cm | LAT: 394 cm |
| 28 Jul, 01:50 Water level compared to NAP: 111 cm | LAT: 417 cm |
| 28 Jul, 02:00 Water level compared to NAP: 131 cm | LAT: 441 cm |
| 28 Jul, 02:10 Water level compared to NAP: 150 cm | LAT: 462 cm |
| 28 Jul, 02:20 Water level compared to NAP: 169 cm | LAT: 487 cm |
| 28 Jul, 02:30 Water level compared to NAP: 187 cm | LAT: 509 cm |
| 28 Jul, 02:40 Water level compared to NAP: 203 cm | LAT: 527 cm |
| 28 Jul, 02:50 Water level compared to NAP: 217 cm | LAT: 541 cm |
| 28 Jul, 03:00 Water level compared to NAP: 228 cm | LAT: 552 cm |
| 28 Jul, 03:10 Water level compared to NAP: 237 cm | LAT: 557 cm |
| 28 Jul, 03:20 Water level compared to NAP: 244 cm | LAT: 559 cm |
| 28 Jul, 03:30 Water level compared to NAP: 247 cm | LAT: 561 cm |
| 28 Jul, 03:40 Water level compared to NAP: 248 cm | LAT: 559 cm |
| 28 Jul, 03:50 Water level compared to NAP: 247 cm | LAT: 555 cm |
| 28 Jul, 04:00 Water level compared to NAP: 243 cm | LAT: 549 cm |
| 28 Jul, 04:10 Water level compared to NAP: 238 cm | LAT: 541 cm |
| 28 Jul, 04:20 Water level compared to NAP: 230 cm | LAT: 531 cm |
| 28 Jul, 04:30 Water level compared to NAP: 221 cm | LAT: 518 cm |
| 28 Jul, 04:40 Water level compared to NAP: 210 cm | LAT: 505 cm |
| 28 Jul, 04:50 Water level compared to NAP: 198 cm | LAT: 491 cm |
| 28 Jul, 05:00 Water level compared to NAP: 185 cm | LAT: 476 cm |
| 28 Jul, 05:10 Water level compared to NAP: 171 cm | LAT: 461 cm |
| 28 Jul, 05:20 Water level compared to NAP: 157 cm | LAT: 446 cm |
| 28 Jul, 05:30 Water level compared to NAP: 143 cm | LAT: 432 cm |
| 28 Jul, 05:40 Water level compared to NAP: 128 cm | LAT: 416 cm |
| 28 Jul, 05:50 Water level compared to NAP: 113 cm | LAT: 403 cm |
| 28 Jul, 06:00 Water level compared to NAP: 98 cm | LAT: 388 cm |
| 28 Jul, 06:10 Water level compared to NAP: 83 cm | LAT: 374 cm |
| 28 Jul, 06:20 Water level compared to NAP: 68 cm | LAT: 359 cm |
| 28 Jul, 06:30 Water level compared to NAP: 53 cm | LAT: 344 cm |
| 28 Jul, 06:40 Water level compared to NAP: 38 cm | LAT: 328 cm |
| 28 Jul, 06:50 Water level compared to NAP: 23 cm | LAT: 312 cm |
| 28 Jul, 07:00 Water level compared to NAP: 8 cm | LAT: 297 cm |
| 28 Jul, 07:10 Water level compared to NAP: -8 cm | LAT: 280 cm |
| 28 Jul, 07:20 Water level compared to NAP: -23 cm | LAT: 263 cm |
| 28 Jul, 07:30 Water level compared to NAP: -39 cm | LAT: 248 cm |
| 28 Jul, 07:40 Water level compared to NAP: -55 cm | LAT: 231 cm |
| 28 Jul, 07:50 Water level compared to NAP: -70 cm | LAT: 217 cm |
| 28 Jul, 08:00 Water level compared to NAP: -85 cm | LAT: 202 cm |
| 28 Jul, 08:10 Water level compared to NAP: -99 cm | LAT: 188 cm |
| 28 Jul, 08:20 Water level compared to NAP: -113 cm | LAT: 174 cm |
| 28 Jul, 08:30 Water level compared to NAP: -127 cm | LAT: 162 cm |
| 28 Jul, 08:40 Water level compared to NAP: -139 cm | LAT: 150 cm |
| 28 Jul, 08:50 Water level compared to NAP: -151 cm | LAT: 138 cm |
| 28 Jul, 09:00 Water level compared to NAP: -161 cm | LAT: 128 cm |
| 28 Jul, 09:10 Water level compared to NAP: -170 cm | LAT: 118 cm |
| 28 Jul, 09:20 Water level compared to NAP: -178 cm | LAT: 110 cm |
| 28 Jul, 09:30 Water level compared to NAP: -183 cm | LAT: 103 cm |
| 28 Jul, 09:40 Water level compared to NAP: -187 cm | LAT: 97 cm |
| 28 Jul, 09:50 Water level compared to NAP: -188 cm | LAT: 95 cm |
| 28 Jul, 10:00 Water level compared to NAP: -187 cm | LAT: 95 cm |
| 28 Jul, 10:10 Water level compared to NAP: -184 cm | LAT: 99 cm |
| 28 Jul, 10:20 Water level compared to NAP: -178 cm | LAT: 106 cm |
| 28 Jul, 10:30 Water level compared to NAP: -170 cm | LAT: 117 cm |
| 28 Jul, 10:40 Water level compared to NAP: -161 cm | LAT: 130 cm |
| 28 Jul, 10:50 Water level compared to NAP: -151 cm | LAT: 142 cm |
| 28 Jul, 11:00 Water level compared to NAP: -139 cm | LAT: 156 cm |
| 28 Jul, 11:10 Water level compared to NAP: -128 cm | LAT: 169 cm |
| 28 Jul, 11:20 Water level compared to NAP: -116 cm | LAT: 184 cm |
| 28 Jul, 11:30 Water level compared to NAP: -104 cm | LAT: 197 cm |
| 28 Jul, 11:40 Water level compared to NAP: -92 cm | LAT: 210 cm |
| 28 Jul, 11:50 Water level compared to NAP: -80 cm | LAT: 224 cm |
| 28 Jul, 12:00 Water level compared to NAP: -68 cm | LAT: 237 cm |
| 28 Jul, 12:10 Water level compared to NAP: -56 cm | LAT: 250 cm |
| 28 Jul, 12:20 Water level compared to NAP: -45 cm | LAT: 261 cm |
| 28 Jul, 12:30 Water level compared to NAP: -33 cm | LAT: 273 cm |
| 28 Jul, 12:40 Water level compared to NAP: -20 cm | LAT: 284 cm |
| 28 Jul, 12:50 Water level compared to NAP: -8 cm | LAT: 296 cm |
| 28 Jul, 13:00 Water level compared to NAP: 5 cm | LAT: 308 cm |
| 28 Jul, 13:10 Water level compared to NAP: 19 cm | LAT: 320 cm |
| 28 Jul, 13:20 Water level compared to NAP: 33 cm | LAT: 332 cm |
| 28 Jul, 13:30 Water level compared to NAP: 48 cm | LAT: 345 cm |
| 28 Jul, 13:40 Water level compared to NAP: 64 cm | LAT: 361 cm |
| 28 Jul, 13:50 Water level compared to NAP: 81 cm | LAT: 376 cm |
| 28 Jul, 14:00 Water level compared to NAP: 99 cm | LAT: 392 cm |
| 28 Jul, 14:10 Water level compared to NAP: 117 cm | LAT: 411 cm |
| 28 Jul, 14:20 Water level compared to NAP: 136 cm | LAT: 433 cm |
| 28 Jul, 14:30 Water level compared to NAP: 154 cm | LAT: 453 cm |
| 28 Jul, 14:40 Water level compared to NAP: 173 cm | LAT: 477 cm |
| 28 Jul, 14:50 Water level compared to NAP: 190 cm | LAT: 499 cm |
| 28 Jul, 15:00 Water level compared to NAP: 206 cm | LAT: 519 cm |
| 28 Jul, 15:10 Water level compared to NAP: 220 cm | LAT: 533 cm |
| 28 Jul, 15:20 Water level compared to NAP: 231 cm | LAT: 547 cm |
| 28 Jul, 15:30 Water level compared to NAP: 241 cm | LAT: 552 cm |
| 26 Jul, 15:40 Water level compared to NAP: 169 cm | LAT: 464 cm |
| 26 Jul, 15:50 Water level compared to NAP: 156 cm | LAT: 451 cm |
| 26 Jul, 16:00 Water level compared to NAP: 144 cm | LAT: 439 cm |
| 26 Jul, 16:10 Water level compared to NAP: 131 cm | LAT: 426 cm |
| 26 Jul, 16:20 Water level compared to NAP: 119 cm | LAT: 414 cm |
| 26 Jul, 16:30 Water level compared to NAP: 107 cm | LAT: 402 cm |
| 26 Jul, 16:40 Water level compared to NAP: 95 cm | LAT: 390 cm |
| 26 Jul, 16:50 Water level compared to NAP: 82 cm | LAT: 377 cm |
| 26 Jul, 17:00 Water level compared to NAP: 69 cm | LAT: 364 cm |
| 26 Jul, 17:10 Water level compared to NAP: 56 cm | LAT: 351 cm |
| 26 Jul, 17:20 Water level compared to NAP: 42 cm | LAT: 337 cm |
| 26 Jul, 17:30 Water level compared to NAP: 27 cm | LAT: 322 cm |
| 26 Jul, 17:40 Water level compared to NAP: 13 cm | LAT: 308 cm |
| 26 Jul, 17:50 Water level compared to NAP: 0 cm | LAT: 295 cm |
| 26 Jul, 18:00 Water level compared to NAP: -15 cm | LAT: 280 cm |
| 26 Jul, 18:10 Water level compared to NAP: -29 cm | LAT: 266 cm |
| 26 Jul, 18:20 Water level compared to NAP: -43 cm | LAT: 252 cm |
| 26 Jul, 18:30 Water level compared to NAP: -56 cm | LAT: 239 cm |
| 26 Jul, 18:40 Water level compared to NAP: -68 cm | LAT: 227 cm |
| 26 Jul, 18:50 Water level compared to NAP: -81 cm | LAT: 214 cm |
| 26 Jul, 19:00 Water level compared to NAP: -92 cm | LAT: 203 cm |
| 26 Jul, 19:10 Water level compared to NAP: -102 cm | LAT: 193 cm |
| 26 Jul, 19:20 Water level compared to NAP: -113 cm | LAT: 182 cm |
| 26 Jul, 19:30 Water level compared to NAP: -122 cm | LAT: 173 cm |
| 26 Jul, 19:40 Water level compared to NAP: -130 cm | LAT: 165 cm |
| 26 Jul, 19:50 Water level compared to NAP: -137 cm | LAT: 158 cm |
| 26 Jul, 20:00 Water level compared to NAP: -144 cm | LAT: 151 cm |
| 26 Jul, 20:10 Water level compared to NAP: -150 cm | LAT: 145 cm |
| 26 Jul, 20:20 Water level compared to NAP: -155 cm | LAT: 140 cm |
| 26 Jul, 20:30 Water level compared to NAP: -159 cm | LAT: 136 cm |
| 26 Jul, 20:40 Water level compared to NAP: -162 cm | LAT: 133 cm |
| 26 Jul, 20:50 Water level compared to NAP: -161 cm | LAT: 134 cm |
| 26 Jul, 21:00 Water level compared to NAP: -160 cm | LAT: 135 cm |
| 26 Jul, 21:10 Water level compared to NAP: -156 cm | LAT: 139 cm |
| 26 Jul, 21:20 Water level compared to NAP: -149 cm | LAT: 146 cm |
| 26 Jul, 21:30 Water level compared to NAP: -140 cm | LAT: 155 cm |
| 26 Jul, 21:40 Water level compared to NAP: -130 cm | LAT: 165 cm |
| 26 Jul, 21:50 Water level compared to NAP: -119 cm | LAT: 176 cm |
| 26 Jul, 22:00 Water level compared to NAP: -105 cm | LAT: 190 cm |
| 26 Jul, 22:10 Water level compared to NAP: -92 cm | LAT: 203 cm |
| 26 Jul, 22:20 Water level compared to NAP: -78 cm | LAT: 217 cm |
| 26 Jul, 22:30 Water level compared to NAP: -64 cm | LAT: 231 cm |
| 26 Jul, 22:40 Water level compared to NAP: -51 cm | LAT: 244 cm |
| 26 Jul, 22:50 Water level compared to NAP: -38 cm | LAT: 257 cm |
| 26 Jul, 23:00 Water level compared to NAP: -25 cm | LAT: 270 cm |
| 26 Jul, 23:10 Water level compared to NAP: -12 cm | LAT: 283 cm |
| 26 Jul, 23:20 Water level compared to NAP: 0 cm | LAT: 295 cm |
| 26 Jul, 23:30 Water level compared to NAP: 12 cm | LAT: 307 cm |
| 26 Jul, 23:40 Water level compared to NAP: 25 cm | LAT: 320 cm |
| 26 Jul, 23:50 Water level compared to NAP: 39 cm | LAT: 334 cm |
| 27 Jul, 00:00 Water level compared to NAP: 52 cm | LAT: 347 cm |
| 27 Jul, 00:10 Water level compared to NAP: 67 cm | LAT: 362 cm |
| 27 Jul, 00:20 Water level compared to NAP: 81 cm | LAT: 376 cm |
| 27 Jul, 00:30 Water level compared to NAP: 97 cm | LAT: 392 cm |
| 27 Jul, 00:40 Water level compared to NAP: 114 cm | LAT: 409 cm |
| 27 Jul, 00:50 Water level compared to NAP: 132 cm | LAT: 427 cm |
| 27 Jul, 01:00 Water level compared to NAP: 153 cm | LAT: 448 cm |
| 27 Jul, 01:10 Water level compared to NAP: 171 cm | LAT: 466 cm |
| 27 Jul, 01:20 Water level compared to NAP: 193 cm | LAT: 488 cm |
| 27 Jul, 01:30 Water level compared to NAP: 213 cm | LAT: 508 cm |
| 27 Jul, 01:40 Water level compared to NAP: 229 cm | LAT: 524 cm |
| 27 Jul, 01:50 Water level compared to NAP: 246 cm | LAT: 541 cm |
| 27 Jul, 02:00 Water level compared to NAP: 257 cm | LAT: 552 cm |
| 27 Jul, 02:10 Water level compared to NAP: 267 cm | LAT: 562 cm |
| 27 Jul, 02:20 Water level compared to NAP: 272 cm | LAT: 567 cm |
| 27 Jul, 02:30 Water level compared to NAP: 273 cm | LAT: 568 cm |
| 27 Jul, 02:40 Water level compared to NAP: 275 cm | LAT: 570 cm |
| 27 Jul, 02:50 Water level compared to NAP: 274 cm | LAT: 569 cm |
| 27 Jul, 03:00 Water level compared to NAP: 271 cm | LAT: 566 cm |
| 27 Jul, 03:10 Water level compared to NAP: 266 cm | LAT: 561 cm |
| 27 Jul, 03:20 Water level compared to NAP: 258 cm | LAT: 553 cm |
| 27 Jul, 03:30 Water level compared to NAP: 249 cm | LAT: 544 cm |
| 27 Jul, 03:40 Water level compared to NAP: 239 cm | LAT: 534 cm |
| 27 Jul, 03:50 Water level compared to NAP: 227 cm | LAT: 522 cm |
| 27 Jul, 04:00 Water level compared to NAP: 214 cm | LAT: 509 cm |
| 27 Jul, 04:10 Water level compared to NAP: 202 cm | LAT: 497 cm |
| 27 Jul, 04:20 Water level compared to NAP: 189 cm | LAT: 484 cm |
| 27 Jul, 04:30 Water level compared to NAP: 175 cm | LAT: 470 cm |
| 27 Jul, 04:40 Water level compared to NAP: 162 cm | LAT: 457 cm |
| 27 Jul, 04:50 Water level compared to NAP: 150 cm | LAT: 445 cm |
| 27 Jul, 05:00 Water level compared to NAP: 136 cm | LAT: 431 cm |
| 27 Jul, 05:10 Water level compared to NAP: 123 cm | LAT: 418 cm |
| 27 Jul, 05:20 Water level compared to NAP: 109 cm | LAT: 404 cm |
| 27 Jul, 05:30 Water level compared to NAP: 95 cm | LAT: 390 cm |
| 27 Jul, 05:40 Water level compared to NAP: 79 cm | LAT: 374 cm |
| 27 Jul, 05:50 Water level compared to NAP: 65 cm | LAT: 360 cm |
| 27 Jul, 06:00 Water level compared to NAP: 49 cm | LAT: 344 cm |
| 27 Jul, 06:10 Water level compared to NAP: 33 cm | LAT: 328 cm |
| 27 Jul, 06:20 Water level compared to NAP: 17 cm | LAT: 312 cm |
| 27 Jul, 06:30 Water level compared to NAP: 2 cm | LAT: 297 cm |
| 27 Jul, 06:40 Water level compared to NAP: -15 cm | LAT: 280 cm |
| 27 Jul, 06:50 Water level compared to NAP: -29 cm | LAT: 266 cm |
| 27 Jul, 07:00 Water level compared to NAP: -44 cm | LAT: 251 cm |
| 27 Jul, 07:10 Water level compared to NAP: -59 cm | LAT: 236 cm |
| 27 Jul, 07:20 Water level compared to NAP: -72 cm | LAT: 223 cm |
| 27 Jul, 07:30 Water level compared to NAP: -85 cm | LAT: 210 cm |
| 27 Jul, 07:40 Water level compared to NAP: -97 cm | LAT: 198 cm |
| 27 Jul, 07:50 Water level compared to NAP: -109 cm | LAT: 186 cm |
| 27 Jul, 08:00 Water level compared to NAP: -119 cm | LAT: 176 cm |
| 27 Jul, 08:10 Water level compared to NAP: -130 cm | LAT: 165 cm |
| 27 Jul, 08:20 Water level compared to NAP: -139 cm | LAT: 156 cm |
| 27 Jul, 08:30 Water level compared to NAP: -146 cm | LAT: 149 cm |
| 27 Jul, 08:40 Water level compared to NAP: -153 cm | LAT: 142 cm |
| 27 Jul, 08:50 Water level compared to NAP: -157 cm | LAT: 138 cm |
| 27 Jul, 09:00 Water level compared to NAP: -160 cm | LAT: 135 cm |
| 27 Jul, 09:10 Water level compared to NAP: -160 cm | LAT: 135 cm |
| 27 Jul, 09:20 Water level compared to NAP: -156 cm | LAT: 139 cm |
| 27 Jul, 09:30 Water level compared to NAP: -151 cm | LAT: 144 cm |
| 27 Jul, 09:40 Water level compared to NAP: -143 cm | LAT: 152 cm |
| 27 Jul, 09:50 Water level compared to NAP: -131 cm | LAT: 164 cm |
| 27 Jul, 10:00 Water level compared to NAP: -120 cm | LAT: 175 cm |
| 27 Jul, 10:10 Water level compared to NAP: -107 cm | LAT: 188 cm |
| 27 Jul, 10:20 Water level compared to NAP: -93 cm | LAT: 202 cm |
| 27 Jul, 10:30 Water level compared to NAP: -80 cm | LAT: 215 cm |
| 27 Jul, 10:40 Water level compared to NAP: -66 cm | LAT: 229 cm |
| 27 Jul, 10:50 Water level compared to NAP: -53 cm | LAT: 242 cm |
| 27 Jul, 11:00 Water level compared to NAP: -40 cm | LAT: 255 cm |
| 27 Jul, 11:10 Water level compared to NAP: -28 cm | LAT: 267 cm |
| 27 Jul, 11:20 Water level compared to NAP: -16 cm | LAT: 279 cm |
| 27 Jul, 11:30 Water level compared to NAP: -5 cm | LAT: 290 cm |
| 27 Jul, 11:40 Water level compared to NAP: 6 cm | LAT: 301 cm |
| 27 Jul, 11:50 Water level compared to NAP: 17 cm | LAT: 312 cm |
| 27 Jul, 12:00 Water level compared to NAP: 28 cm | LAT: 323 cm |
| 27 Jul, 12:10 Water level compared to NAP: 39 cm | LAT: 334 cm |
| 27 Jul, 12:20 Water level compared to NAP: 50 cm | LAT: 345 cm |
| 27 Jul, 12:30 Water level compared to NAP: 62 cm | LAT: 357 cm |
| 27 Jul, 12:40 Water level compared to NAP: 74 cm | LAT: 369 cm |
| 27 Jul, 12:50 Water level compared to NAP: 86 cm | LAT: 381 cm |
| 27 Jul, 13:00 Water level compared to NAP: 101 cm | LAT: 396 cm |
| 27 Jul, 13:10 Water level compared to NAP: 116 cm | LAT: 411 cm |
| 27 Jul, 13:20 Water level compared to NAP: 130 cm | LAT: 425 cm |
| 27 Jul, 13:30 Water level compared to NAP: 149 cm | LAT: 444 cm |
| 27 Jul, 13:40 Water level compared to NAP: 168 cm | LAT: 463 cm |
| 27 Jul, 13:50 Water level compared to NAP: 185 cm | LAT: 480 cm |
| 27 Jul, 14:00 Water level compared to NAP: 205 cm | LAT: 500 cm |
| 27 Jul, 14:10 Water level compared to NAP: 223 cm | LAT: 518 cm |
| 27 Jul, 14:20 Water level compared to NAP: 237 cm | LAT: 532 cm |
| 27 Jul, 14:30 Water level compared to NAP: 248 cm | LAT: 543 cm |
| 27 Jul, 14:40 Water level compared to NAP: 255 cm | LAT: 550 cm |
| 27 Jul, 14:50 Water level compared to NAP: 261 cm | LAT: 556 cm |
| 27 Jul, 15:00 Water level compared to NAP: 262 cm | LAT: 557 cm |
| 27 Jul, 15:10 Water level compared to NAP: 262 cm | LAT: 557 cm |
| 27 Jul, 15:20 Water level compared to NAP: 259 cm | LAT: 554 cm |
| 27 Jul, 15:30 Water level compared to NAP: 255 cm | LAT: 550 cm |
| 27 Jul, 15:40 Water level compared to NAP: 247 cm | LAT: 542 cm |
| 27 Jul, 15:50 Water level compared to NAP: 237 cm | LAT: 532 cm |
| 27 Jul, 16:00 Water level compared to NAP: 226 cm | LAT: 521 cm |
| 27 Jul, 16:10 Water level compared to NAP: 214 cm | LAT: 509 cm |
| 27 Jul, 16:20 Water level compared to NAP: 200 cm | LAT: 495 cm |
| 27 Jul, 16:30 Water level compared to NAP: 187 cm | LAT: 482 cm |
| 27 Jul, 16:40 Water level compared to NAP: 172 cm | LAT: 467 cm |
| 27 Jul, 16:50 Water level compared to NAP: 158 cm | LAT: 453 cm |
| 27 Jul, 17:00 Water level compared to NAP: 144 cm | LAT: 439 cm |
| 27 Jul, 17:10 Water level compared to NAP: 130 cm | LAT: 425 cm |
| 27 Jul, 17:20 Water level compared to NAP: 117 cm | LAT: 412 cm |
| 27 Jul, 17:30 Water level compared to NAP: 103 cm | LAT: 398 cm |
| 27 Jul, 17:40 Water level compared to NAP: 89 cm | LAT: 384 cm |
| 27 Jul, 17:50 Water level compared to NAP: 74 cm | LAT: 369 cm |
| 27 Jul, 18:00 Water level compared to NAP: 59 cm | LAT: 354 cm |
| 27 Jul, 18:10 Water level compared to NAP: 43 cm | LAT: 338 cm |
| 27 Jul, 18:20 Water level compared to NAP: 27 cm | LAT: 322 cm |
| 27 Jul, 18:30 Water level compared to NAP: 11 cm | LAT: 306 cm |
| 27 Jul, 18:40 Water level compared to NAP: -5 cm | LAT: 290 cm |
| 27 Jul, 18:50 Water level compared to NAP: -22 cm | LAT: 273 cm |
| 27 Jul, 19:00 Water level compared to NAP: -37 cm | LAT: 258 cm |
| 27 Jul, 19:10 Water level compared to NAP: -53 cm | LAT: 242 cm |
| 27 Jul, 19:20 Water level compared to NAP: -68 cm | LAT: 227 cm |
| 27 Jul, 19:30 Water level compared to NAP: -83 cm | LAT: 212 cm |
| 27 Jul, 19:40 Water level compared to NAP: -97 cm | LAT: 198 cm |
| 27 Jul, 19:50 Water level compared to NAP: -111 cm | LAT: 184 cm |
| 27 Jul, 20:00 Water level compared to NAP: -124 cm | LAT: 171 cm |
| 27 Jul, 20:10 Water level compared to NAP: -137 cm | LAT: 158 cm |
| 27 Jul, 20:20 Water level compared to NAP: -148 cm | LAT: 147 cm |
| 27 Jul, 20:30 Water level compared to NAP: -159 cm | LAT: 136 cm |
| 27 Jul, 20:40 Water level compared to NAP: -169 cm | LAT: 126 cm |
| 27 Jul, 20:50 Water level compared to NAP: -177 cm | LAT: 118 cm |
| 27 Jul, 21:00 Water level compared to NAP: -185 cm | LAT: 110 cm |
| 27 Jul, 21:10 Water level compared to NAP: -193 cm | LAT: 102 cm |
| 27 Jul, 21:20 Water level compared to NAP: -198 cm | LAT: 97 cm |
| 27 Jul, 21:30 Water level compared to NAP: -202 cm | LAT: 93 cm |
| 27 Jul, 21:40 Water level compared to NAP: -204 cm | LAT: 91 cm |
| 27 Jul, 21:50 Water level compared to NAP: -203 cm | LAT: 92 cm |
| 27 Jul, 22:00 Water level compared to NAP: -200 cm | LAT: 95 cm |
| 27 Jul, 22:10 Water level compared to NAP: -195 cm | LAT: 100 cm |
| 27 Jul, 22:20 Water level compared to NAP: -184 cm | LAT: 111 cm |
| 27 Jul, 22:30 Water level compared to NAP: -174 cm | LAT: 121 cm |
| 27 Jul, 22:40 Water level compared to NAP: -161 cm | LAT: 134 cm |
| 27 Jul, 22:50 Water level compared to NAP: -148 cm | LAT: 147 cm |
| 27 Jul, 23:00 Water level compared to NAP: -134 cm | LAT: 161 cm |
| 27 Jul, 23:10 Water level compared to NAP: -120 cm | LAT: 175 cm |
| 27 Jul, 23:20 Water level compared to NAP: -106 cm | LAT: 189 cm |
| 27 Jul, 23:30 Water level compared to NAP: -92 cm | LAT: 203 cm |
| 27 Jul, 23:40 Water level compared to NAP: -77 cm | LAT: 218 cm |
| 27 Jul, 23:50 Water level compared to NAP: -65 cm | LAT: 230 cm |
| 28 Jul, 00:00 Water level compared to NAP: -51 cm | LAT: 244 cm |
| 28 Jul, 00:10 Water level compared to NAP: -38 cm | LAT: 257 cm |
| 28 Jul, 00:20 Water level compared to NAP: -26 cm | LAT: 269 cm |
| 28 Jul, 00:30 Water level compared to NAP: -13 cm | LAT: 282 cm |
| 28 Jul, 00:40 Water level compared to NAP: 0 cm | LAT: 295 cm |
| 28 Jul, 00:50 Water level compared to NAP: 14 cm | LAT: 309 cm |
| 28 Jul, 01:00 Water level compared to NAP: 29 cm | LAT: 324 cm |
| 28 Jul, 01:10 Water level compared to NAP: 45 cm | LAT: 340 cm |
| 28 Jul, 01:20 Water level compared to NAP: 62 cm | LAT: 357 cm |
| 28 Jul, 01:30 Water level compared to NAP: 81 cm | LAT: 376 cm |
| 28 Jul, 01:40 Water level compared to NAP: 99 cm | LAT: 394 cm |
| 28 Jul, 01:50 Water level compared to NAP: 122 cm | LAT: 417 cm |
| 28 Jul, 02:00 Water level compared to NAP: 146 cm | LAT: 441 cm |
| 28 Jul, 02:10 Water level compared to NAP: 167 cm | LAT: 462 cm |
| 28 Jul, 02:20 Water level compared to NAP: 192 cm | LAT: 487 cm |
| 28 Jul, 02:30 Water level compared to NAP: 214 cm | LAT: 509 cm |
| 28 Jul, 02:40 Water level compared to NAP: 232 cm | LAT: 527 cm |
| 28 Jul, 02:50 Water level compared to NAP: 246 cm | LAT: 541 cm |
| 28 Jul, 03:00 Water level compared to NAP: 257 cm | LAT: 552 cm |
| 28 Jul, 03:10 Water level compared to NAP: 262 cm | LAT: 557 cm |
| 28 Jul, 03:20 Water level compared to NAP: 264 cm | LAT: 559 cm |
| 28 Jul, 03:30 Water level compared to NAP: 266 cm | LAT: 561 cm |
| 28 Jul, 03:40 Water level compared to NAP: 264 cm | LAT: 559 cm |
| 28 Jul, 03:50 Water level compared to NAP: 260 cm | LAT: 555 cm |
| 28 Jul, 04:00 Water level compared to NAP: 254 cm | LAT: 549 cm |
| 28 Jul, 04:10 Water level compared to NAP: 246 cm | LAT: 541 cm |
| 28 Jul, 04:20 Water level compared to NAP: 236 cm | LAT: 531 cm |
| 28 Jul, 04:30 Water level compared to NAP: 223 cm | LAT: 518 cm |
| 28 Jul, 04:40 Water level compared to NAP: 210 cm | LAT: 505 cm |
| 28 Jul, 04:50 Water level compared to NAP: 196 cm | LAT: 491 cm |
| 28 Jul, 05:00 Water level compared to NAP: 181 cm | LAT: 476 cm |
| 28 Jul, 05:10 Water level compared to NAP: 166 cm | LAT: 461 cm |
| 28 Jul, 05:20 Water level compared to NAP: 151 cm | LAT: 446 cm |
| 28 Jul, 05:30 Water level compared to NAP: 137 cm | LAT: 432 cm |
| 28 Jul, 05:40 Water level compared to NAP: 121 cm | LAT: 416 cm |
| 28 Jul, 05:50 Water level compared to NAP: 108 cm | LAT: 403 cm |
| 28 Jul, 06:00 Water level compared to NAP: 93 cm | LAT: 388 cm |
| 28 Jul, 06:10 Water level compared to NAP: 79 cm | LAT: 374 cm |
| 28 Jul, 06:20 Water level compared to NAP: 64 cm | LAT: 359 cm |
| 28 Jul, 06:30 Water level compared to NAP: 49 cm | LAT: 344 cm |
| 28 Jul, 06:40 Water level compared to NAP: 33 cm | LAT: 328 cm |
| 28 Jul, 06:50 Water level compared to NAP: 17 cm | LAT: 312 cm |
| 28 Jul, 07:00 Water level compared to NAP: 2 cm | LAT: 297 cm |
| 28 Jul, 07:10 Water level compared to NAP: -15 cm | LAT: 280 cm |
| 28 Jul, 07:20 Water level compared to NAP: -32 cm | LAT: 263 cm |
| 28 Jul, 07:30 Water level compared to NAP: -47 cm | LAT: 248 cm |
| 28 Jul, 07:40 Water level compared to NAP: -64 cm | LAT: 231 cm |
| 28 Jul, 07:50 Water level compared to NAP: -78 cm | LAT: 217 cm |
| 28 Jul, 08:00 Water level compared to NAP: -93 cm | LAT: 202 cm |
| 28 Jul, 08:10 Water level compared to NAP: -107 cm | LAT: 188 cm |
| 28 Jul, 08:20 Water level compared to NAP: -121 cm | LAT: 174 cm |
| 28 Jul, 08:30 Water level compared to NAP: -133 cm | LAT: 162 cm |
| 28 Jul, 08:40 Water level compared to NAP: -145 cm | LAT: 150 cm |
| 28 Jul, 08:50 Water level compared to NAP: -157 cm | LAT: 138 cm |
| 28 Jul, 09:00 Water level compared to NAP: -167 cm | LAT: 128 cm |
| 28 Jul, 09:10 Water level compared to NAP: -177 cm | LAT: 118 cm |
| 28 Jul, 09:20 Water level compared to NAP: -185 cm | LAT: 110 cm |
| 28 Jul, 09:30 Water level compared to NAP: -192 cm | LAT: 103 cm |
| 28 Jul, 09:40 Water level compared to NAP: -198 cm | LAT: 97 cm |
| 28 Jul, 09:50 Water level compared to NAP: -200 cm | LAT: 95 cm |
| 28 Jul, 10:00 Water level compared to NAP: -200 cm | LAT: 95 cm |
| 28 Jul, 10:10 Water level compared to NAP: -196 cm | LAT: 99 cm |
| 28 Jul, 10:20 Water level compared to NAP: -189 cm | LAT: 106 cm |
| 28 Jul, 10:30 Water level compared to NAP: -178 cm | LAT: 117 cm |
| 28 Jul, 10:40 Water level compared to NAP: -165 cm | LAT: 130 cm |
| 28 Jul, 10:50 Water level compared to NAP: -153 cm | LAT: 142 cm |
| 28 Jul, 11:00 Water level compared to NAP: -139 cm | LAT: 156 cm |
| 28 Jul, 11:10 Water level compared to NAP: -126 cm | LAT: 169 cm |
| 28 Jul, 11:20 Water level compared to NAP: -111 cm | LAT: 184 cm |
| 28 Jul, 11:30 Water level compared to NAP: -98 cm | LAT: 197 cm |
| 28 Jul, 11:40 Water level compared to NAP: -85 cm | LAT: 210 cm |
| 28 Jul, 11:50 Water level compared to NAP: -71 cm | LAT: 224 cm |
| 28 Jul, 12:00 Water level compared to NAP: -58 cm | LAT: 237 cm |
| 28 Jul, 12:10 Water level compared to NAP: -45 cm | LAT: 250 cm |
| 28 Jul, 12:20 Water level compared to NAP: -34 cm | LAT: 261 cm |
| 28 Jul, 12:30 Water level compared to NAP: -22 cm | LAT: 273 cm |
| 28 Jul, 12:40 Water level compared to NAP: -11 cm | LAT: 284 cm |
| 28 Jul, 12:50 Water level compared to NAP: 1 cm | LAT: 296 cm |
| 28 Jul, 13:00 Water level compared to NAP: 13 cm | LAT: 308 cm |
| 28 Jul, 13:10 Water level compared to NAP: 25 cm | LAT: 320 cm |
| 28 Jul, 13:20 Water level compared to NAP: 37 cm | LAT: 332 cm |
| 28 Jul, 13:30 Water level compared to NAP: 50 cm | LAT: 345 cm |
| 28 Jul, 13:40 Water level compared to NAP: 66 cm | LAT: 361 cm |
| 28 Jul, 13:50 Water level compared to NAP: 81 cm | LAT: 376 cm |
| 28 Jul, 14:00 Water level compared to NAP: 97 cm | LAT: 392 cm |
| 28 Jul, 14:10 Water level compared to NAP: 116 cm | LAT: 411 cm |
| 28 Jul, 14:20 Water level compared to NAP: 138 cm | LAT: 433 cm |
| 28 Jul, 14:30 Water level compared to NAP: 158 cm | LAT: 453 cm |
| 28 Jul, 14:40 Water level compared to NAP: 182 cm | LAT: 477 cm |
| 28 Jul, 14:50 Water level compared to NAP: 204 cm | LAT: 499 cm |
| 28 Jul, 15:00 Water level compared to NAP: 224 cm | LAT: 519 cm |
| 28 Jul, 15:10 Water level compared to NAP: 238 cm | LAT: 533 cm |
| 28 Jul, 15:20 Water level compared to NAP: 252 cm | LAT: 547 cm |
| 28 Jul, 15:30 Water level compared to NAP: 257 cm | LAT: 552 cm |
Tide curve Bath
The graph above shows the progression of the tide at Bath see. The blue line follows the astronomical tide forecast in NAP, which is the data that you also see in the table on the left in the '10 min' column. The orange line, however, shows the astronomical forecast plus - or minus - the setup. The influences of the weather and current are therefore included, so that the orange line represents the most likely scenario. About the reference planes (NAP and LAT)
Most of the tide data you see here is shown relative to NAP (Normal Amsterdam Level). However, the measuring stations Aukfield, Europlatform, K13A and the Lichteiland Goeree give their values in MSL, Mean Sea Level, which represents the average sea level. LAT is an international reference plane and stands for Lowest Astronomical Tide. It is used as a reference plane for water depths on nautical charts. If you use this, it is best to maintain this level. LAT represents the lowest possible tide at a given location, which is only reached at highly exceptional times. Normally the water level will therefore always be above it.
A standard difference between NAP and LAT is known for each tidal location, the standard difference between NAP and LAT at Bath is: 299 cm
Want to know more? The Wadvaarders Foundation has an interesting explanation about LAT vs. NAP on its website.
Overview of measuring stations
Map of the Netherlands